RigLink RemoteA remote truck diagnostics console, built as a working preview that runs in the browser.

RigLink Remote is a console for diagnosing a truck from somewhere else: live J1939 readings, fault codes, a calibration vault, and a guided read and write of the engine controller's calibration that recovers when the connection drops. The preview runs entirely in your browser.

RigLink Remote is an Awan Forge product concept with a working interactive preview. Diagnostics and ECM programming run against a simulator. Real vehicle support is not released.

Open RigLink

Opens connected. No account or setup.

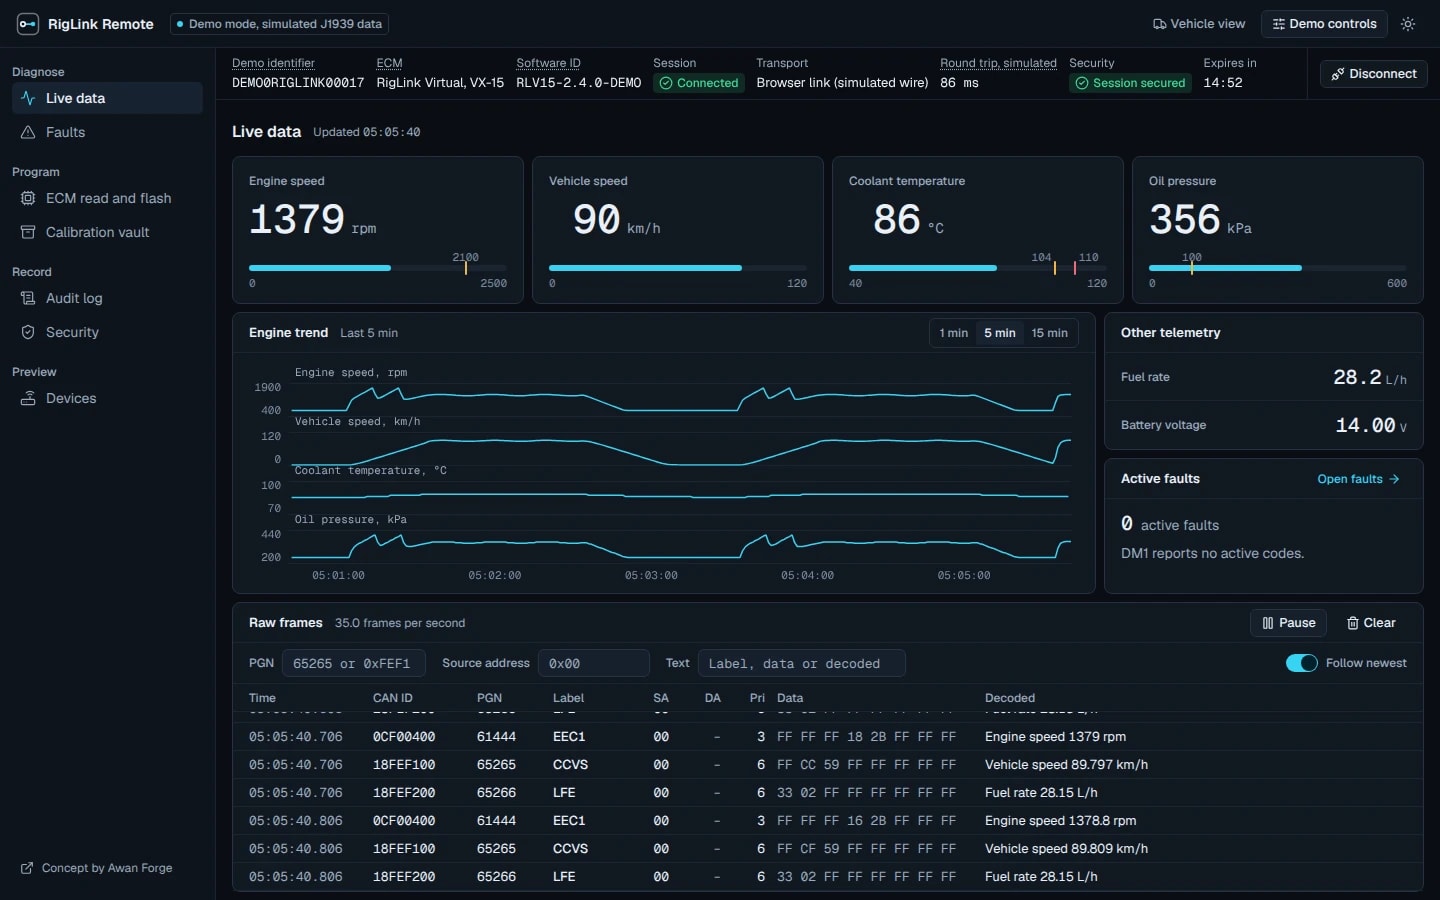
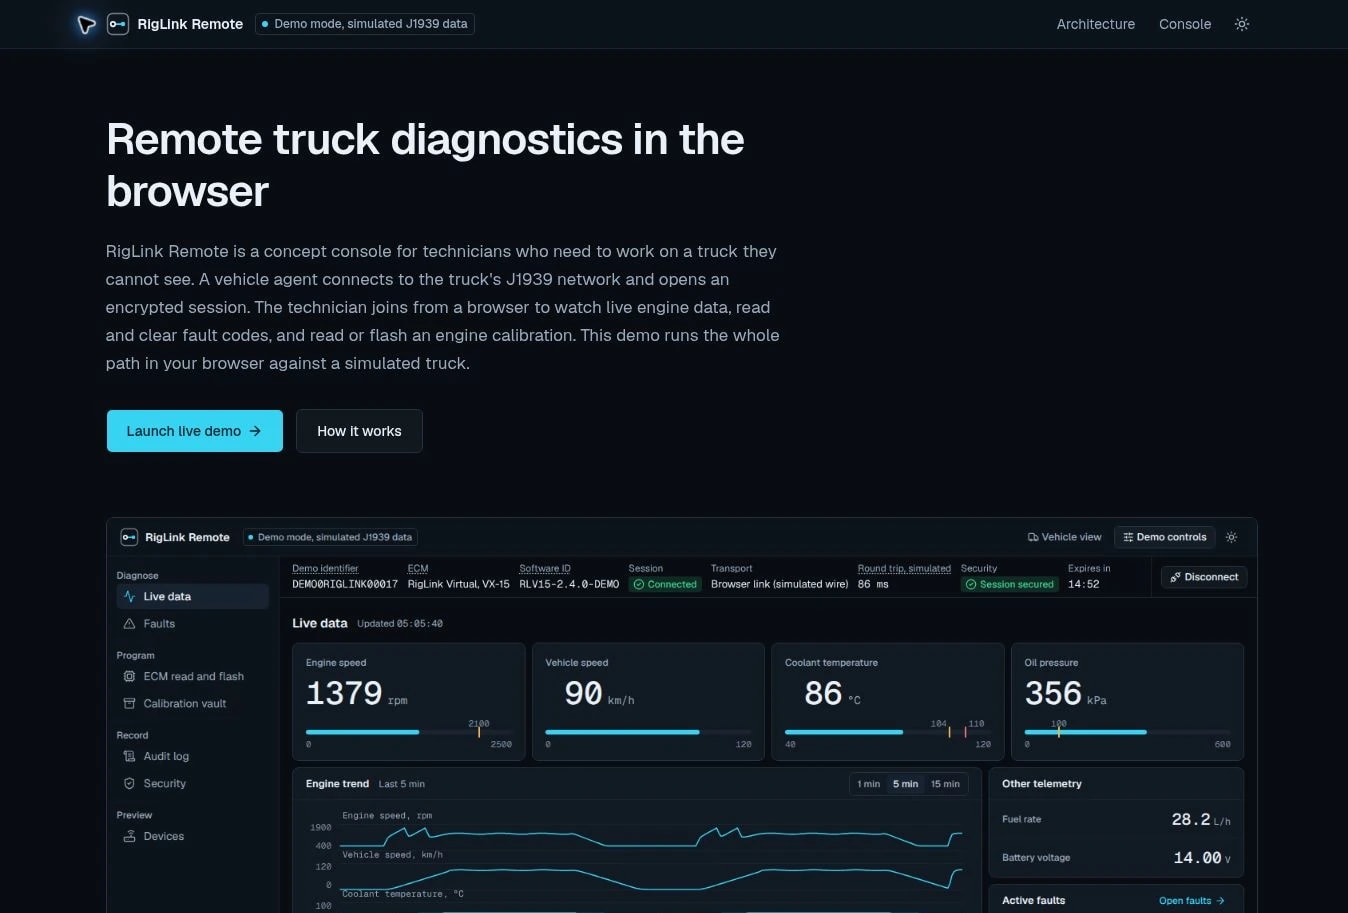
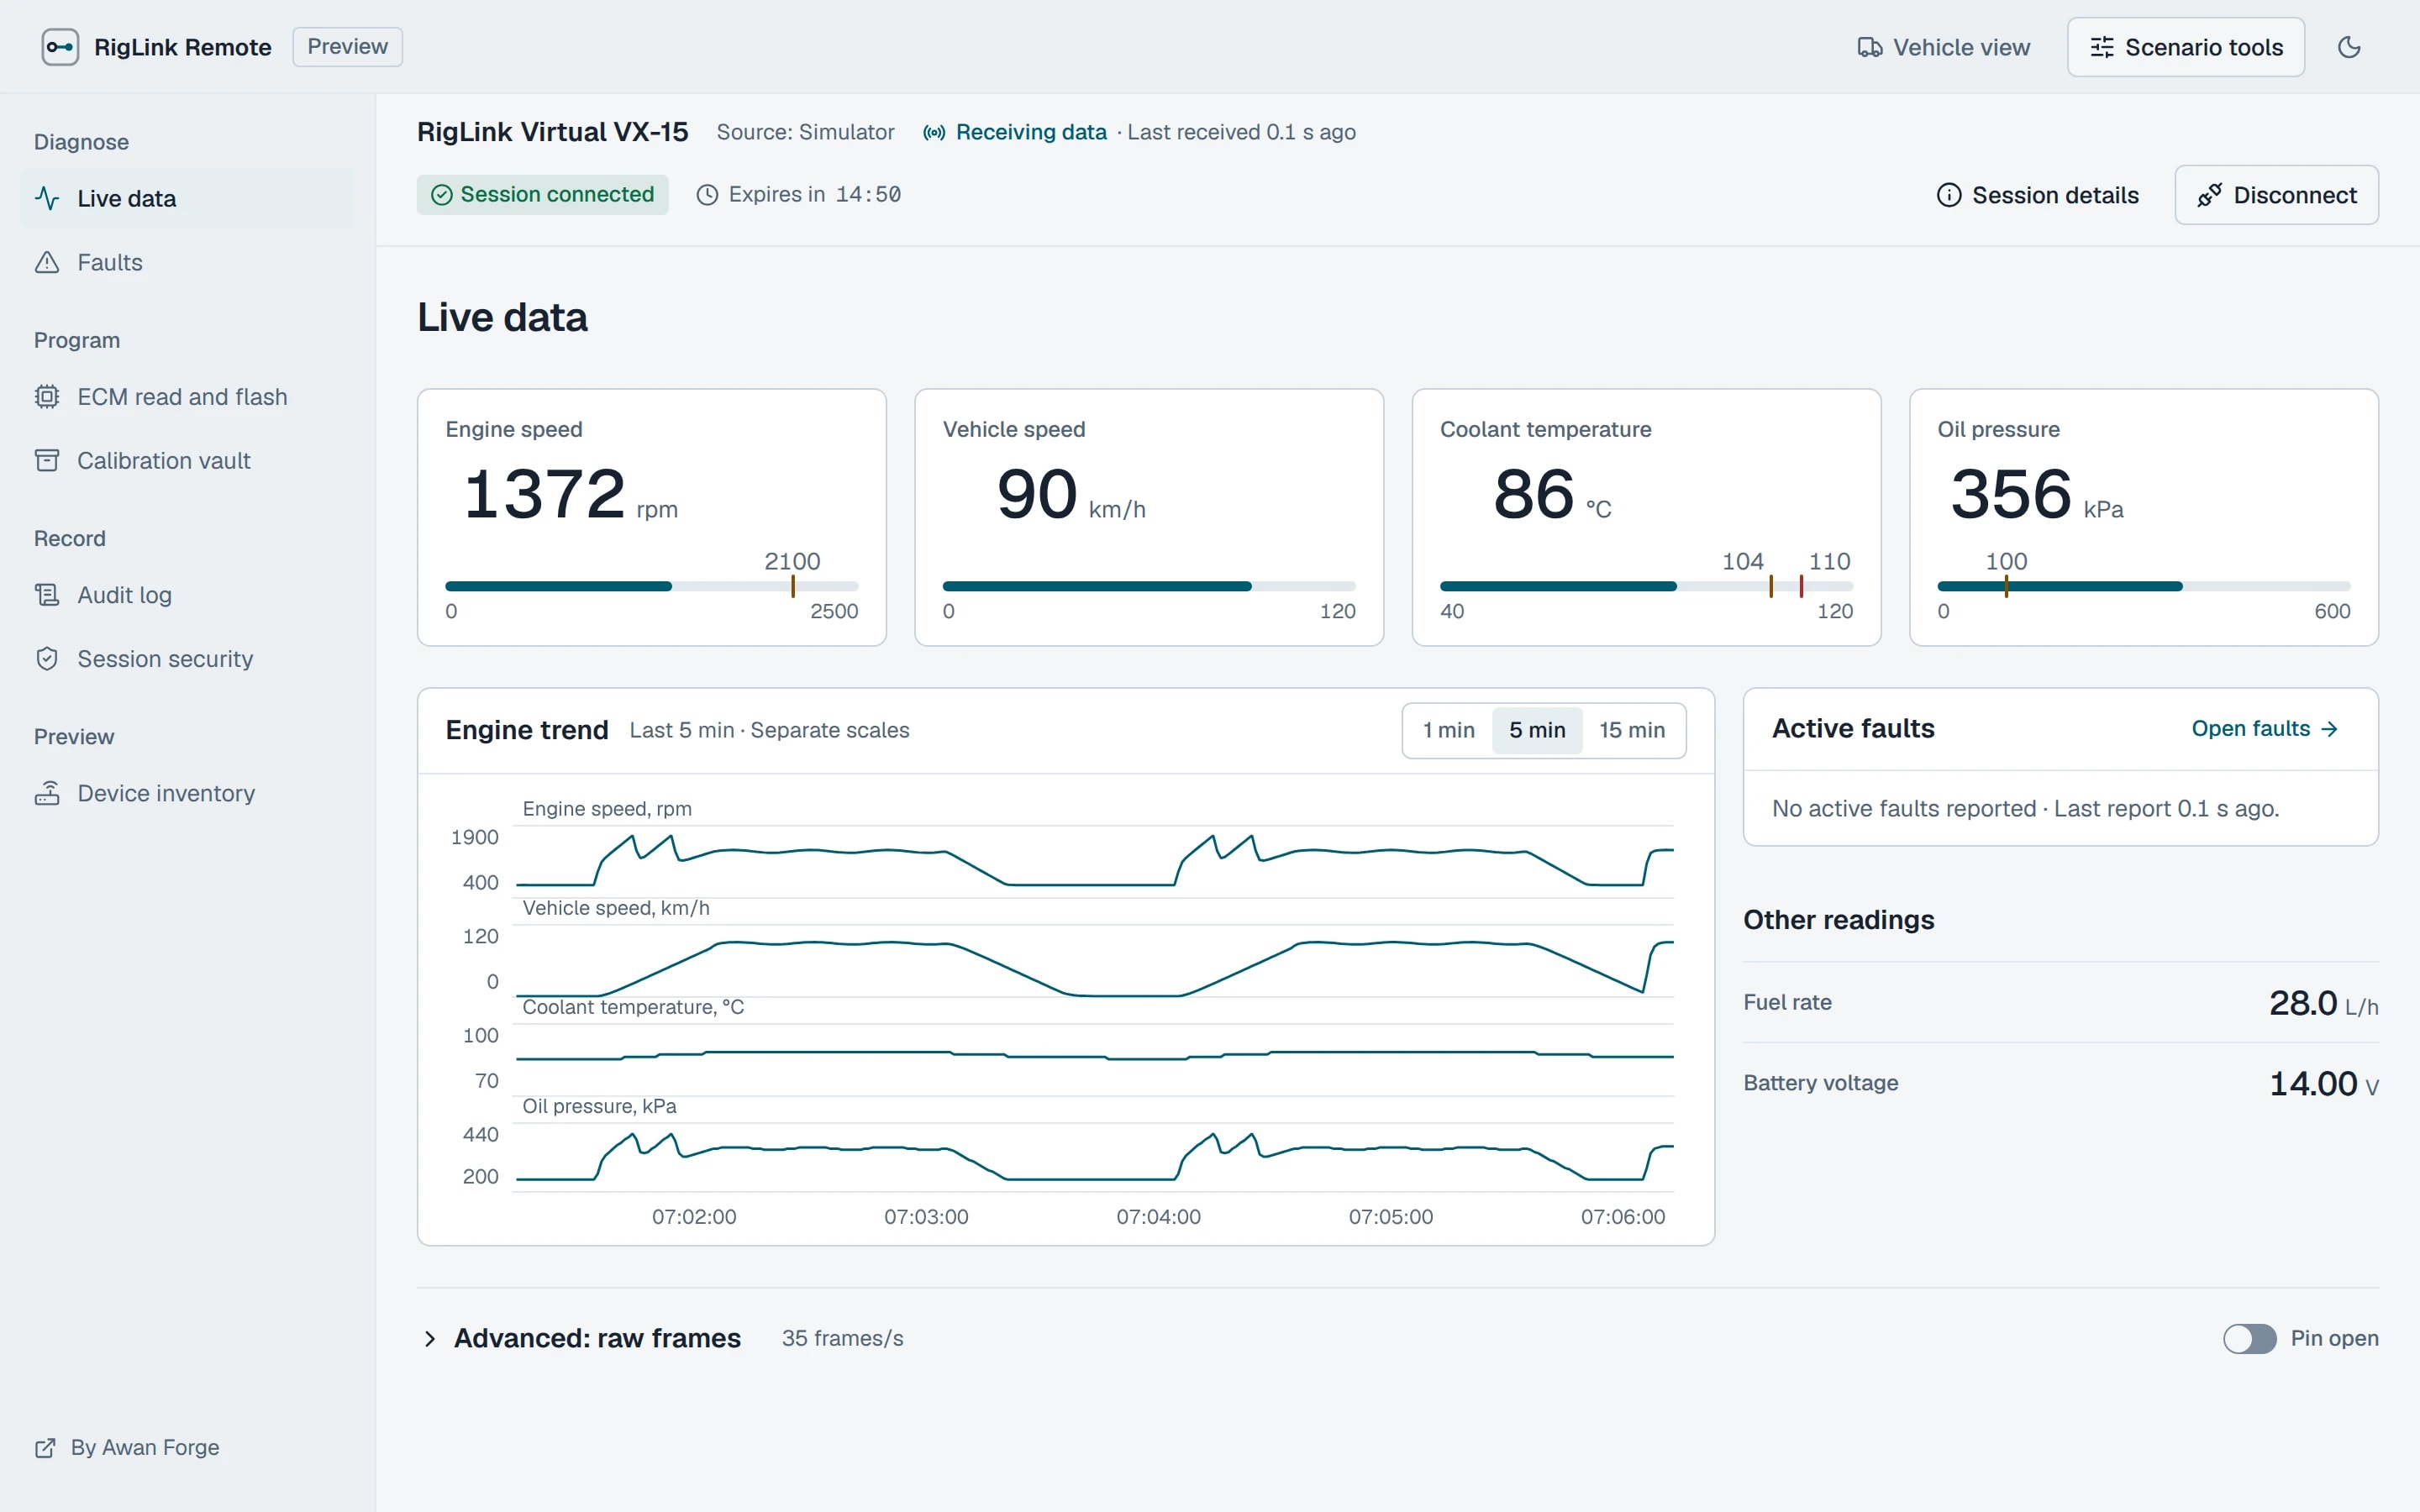
RigLink Remote console showing engine speed, vehicle speed, coolant temperature and oil pressure as four range instruments above a trend chart, with the session state and data source in a bar across the top.

The Live data screen of the preview. Every number comes from decoded J1939 frames produced by the simulator.

Type
Awan Forge product concept
Status
Interactive preview. Runs on a simulator.
Our work
Research, interface design, protocol and simulator, encrypted session, web console, relay, Windows agent, testing, deployment
Built with
Next.js, TypeScript, WebCrypto, Node, .NET
Date
November 2026

The technician cannot see the truck

A shop plugs a diagnostic adapter into a truck and shares a session link. A technician in another place opens the link in a browser and works on the engine controller from there.

Everything that technician knows about the truck arrives through the session. That gives the console three jobs, in this order:

  1. Show the state of the link and the vehicle at all times, so nothing is done blind.
  2. Present each measurement so a number, its unit and its limit can be read in one look.
  3. Make the one dangerous step, writing a calibration, impossible to start in the wrong conditions and easy to follow when the link fails.

A reading that is no longer current has to say so. Our first version missed that, and the design review below shows the correction.

Who it is for, and what we had to work within

Two people use RigLink. The remote technician works in the console. Someone at the vehicle starts the session from the vehicle view, which mirrors the Windows agent on the shop PC, and hands over a link, a QR code and a pairing code.

RigLink is our own concept. We set its goals ourselves, from published service documentation and from the constraints of the project.

Goals

  • Every number on screen comes from decoded vehicle data. No screen generates its own.
  • The write workflow refuses to start until its checks pass, and recovers from a lost link at a known point.
  • Scope is stated plainly, in the place where a reader would otherwise assume more.

Constraints

No hardware
We had no adapter and no truck. So the data path had to be real from end to end, and the hardware layer had to be a separate, labeled part that a real adapter can replace.
No paid standards
The SAE J1939 documents and the RP1210 specification are sold, and we did not buy them. Every protocol fact in the project rests on a public source that we recorded.
No backend for visitors
The preview had to work for someone with no account, no server and no setup.
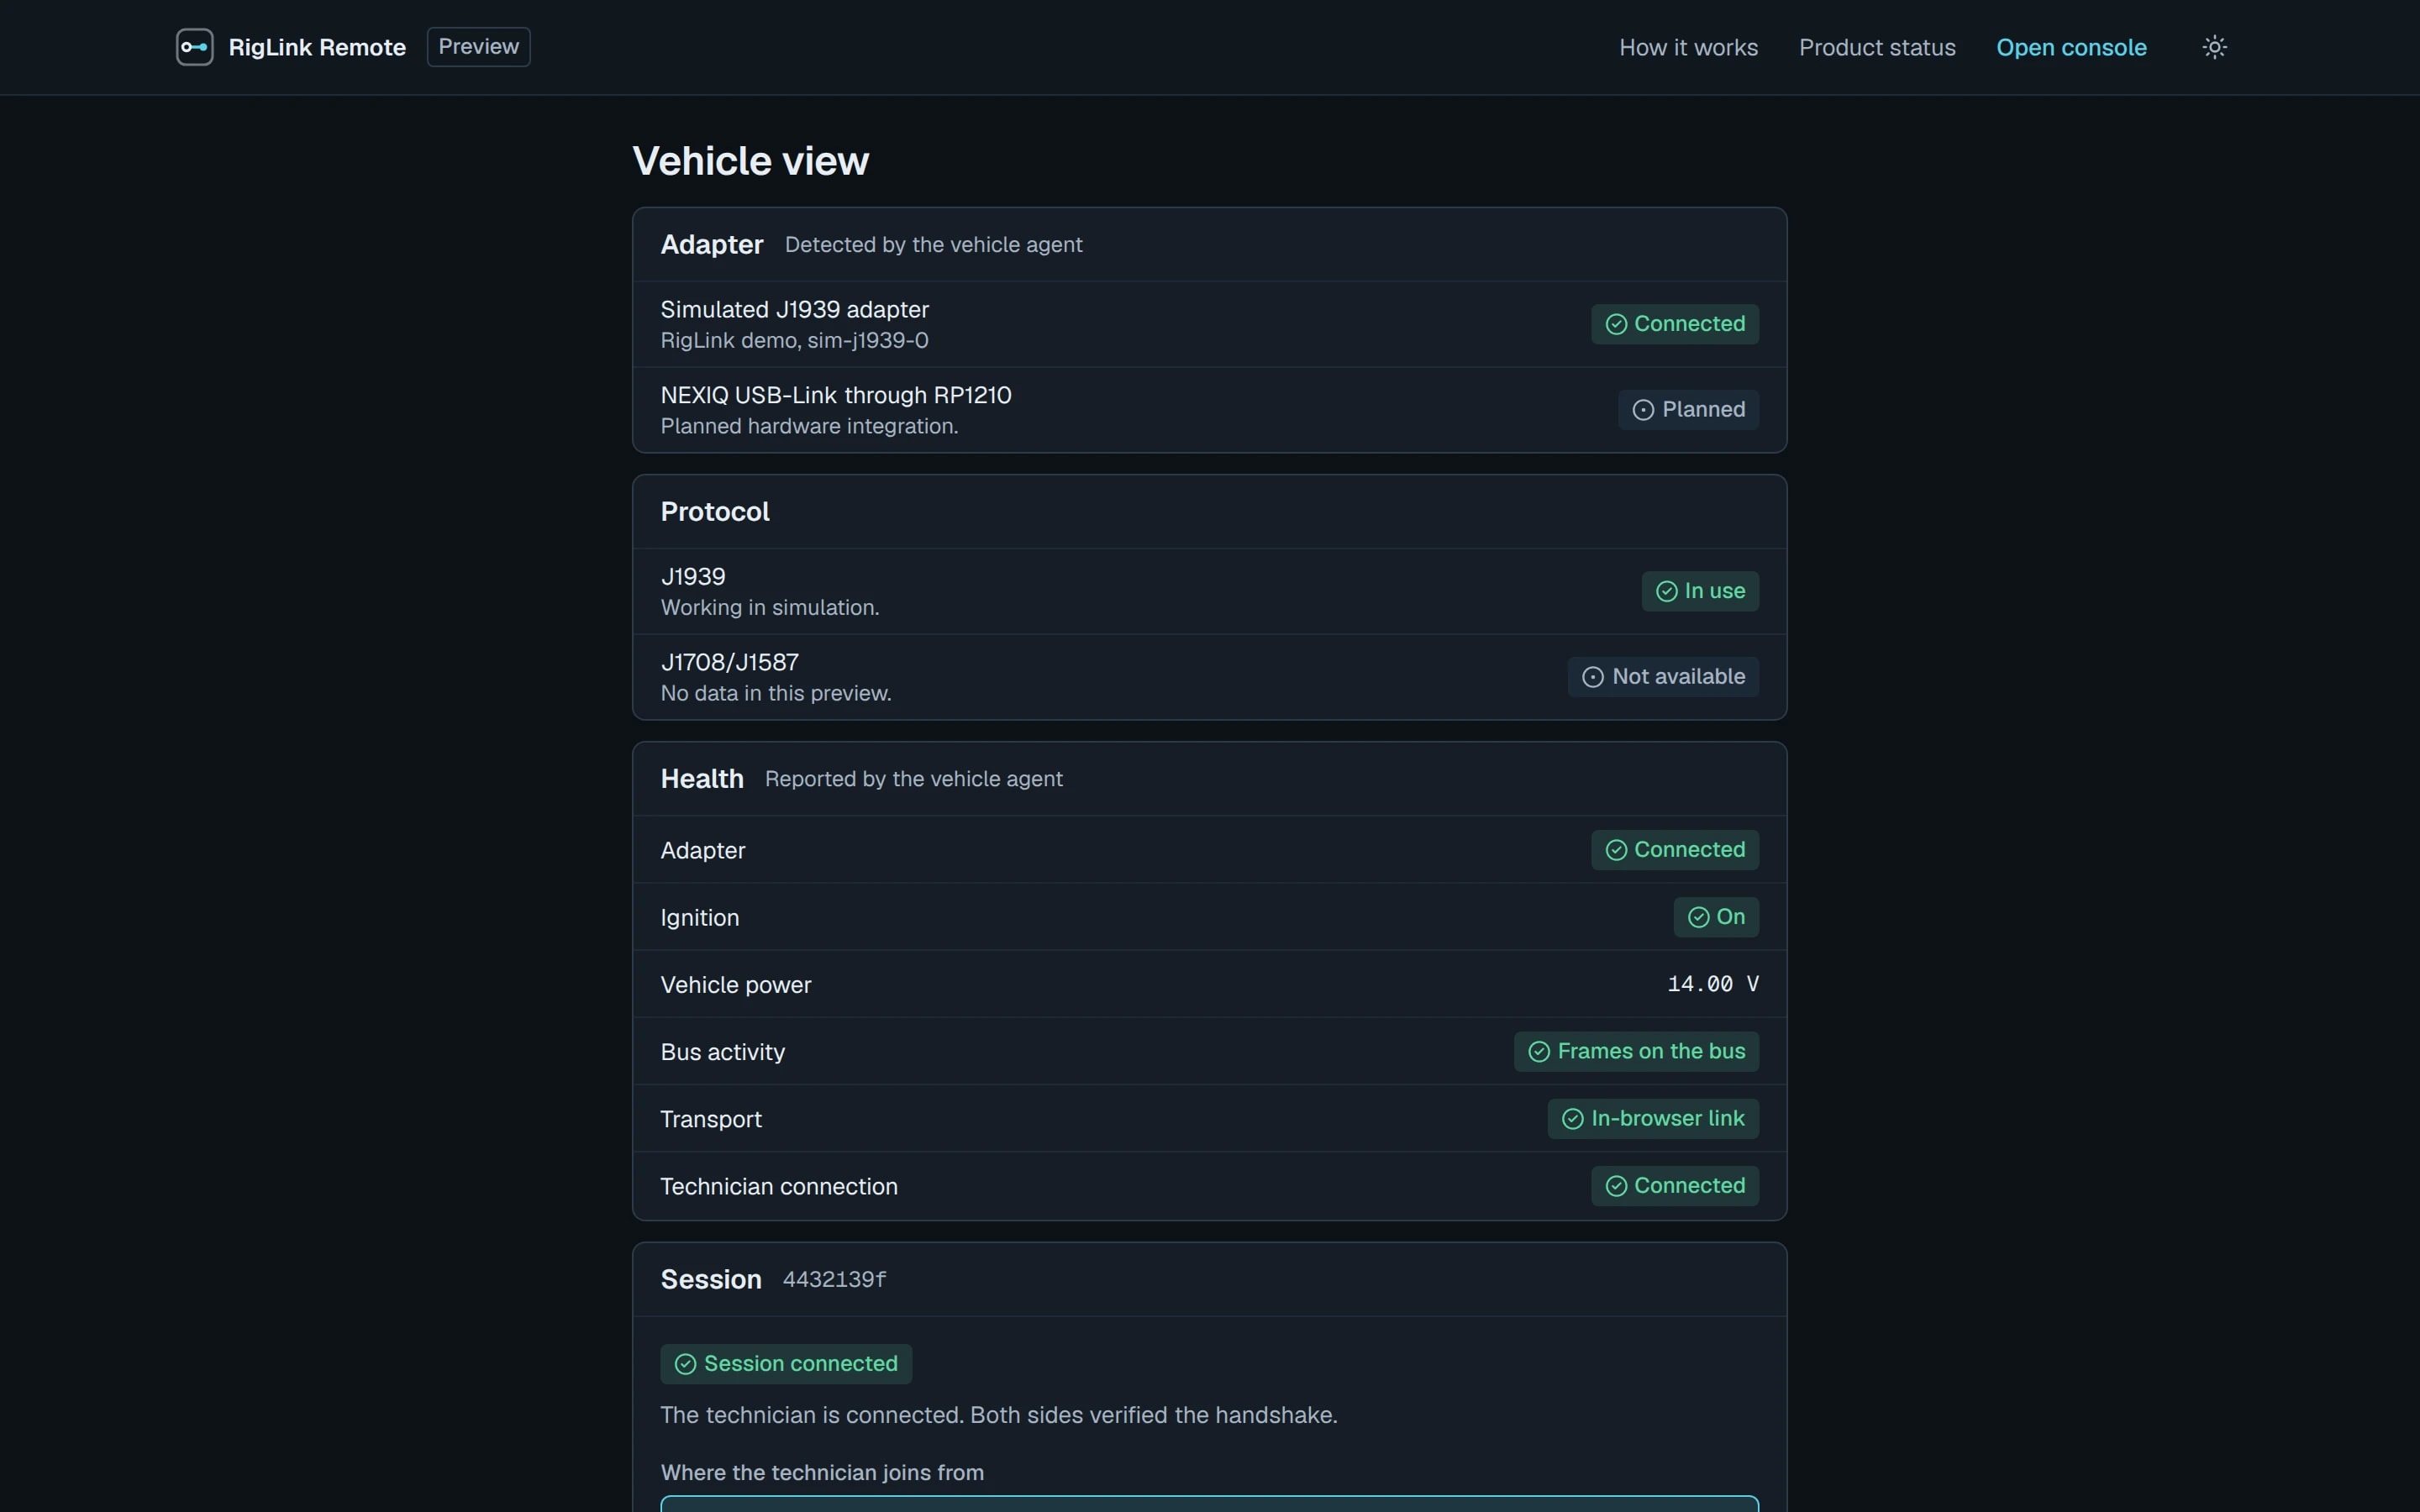
RigLink vehicle view with adapter, protocol, health and session panels in a single column.

The vehicle view, used by the person at the truck. It lists the adapter, the protocol and the health of the connection, and creates the session the technician joins.

  1. The simulated adapter is connected. The hardware adapter is listed as planned.
  2. J1939 runs in simulation. J1708/J1587 is listed as not available.

Research first: a quiet instrument workbench

We wrote the design direction before any interface code. For each source we recorded what we took and what we left.

Design sources and what we took from each
SourceWhat we took
Tesla's public Service Mode User GuideThe structure of a service tool: a left rail of destinations, vehicle identity that stays on screen, the exit action in a fixed place, active alerts kept apart from earlier ones, a plain warning before a write. Structure only, from the public guide.
Linear's articles on its interface redesignsNavigation recedes and content carries the weight. Structure comes from thin separators.
Vercel's Geist design systemSeparate type roles for labels and for readings, tabular numerals for anything that updates, status colors that always carry text.
Grafana's dashboard guidanceOne question per graph. That became four small plots on one time axis, each with its own unit axis, in place of one plot with four competing scales.
Nielsen's usability heuristicsVisibility of system status and error prevention, each turned into a decision and a check.
Dribbble, four searches and six shots viewedHairline panel structure, a status table with one badge per row, vehicle identity in a persistent header.

The direction fits in four words: a quiet instrument workbench. Dark chrome that recedes, one cyan accent for actions and live data, status colors used only for status, and every measured value shown with its unit.

Its signature element is the range instrument: a large numeral over a horizontal track with threshold marks. We chose it over a radial gauge because it shows value, range and limit in less space and without decoration.

We left out what the reference shots leaned on most: maps, vehicle renders, isometric scenes, glass panels, saturated tile fills and radial gauges. A map belongs to a fleet product, and RigLink is one vehicle in one session. A half-circle gauge spends a whole panel on one number.

Each borrowed pattern was written down with a check that could fail. One example: the engine speed numeral must keep its position while its digits change, measured across 20 updates.

6

patterns borrowed, each with a verification criterion

60+

technical sources recorded with URL and access date

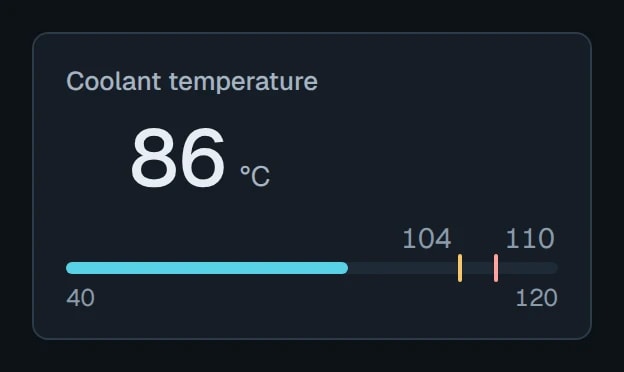
Coolant temperature instrument reading 86 degrees Celsius above a horizontal range track from 40 to 120 with threshold marks at 104 and 110.

The range instrument. One numeral, its unit, the working range and the warning and critical thresholds, in the space a radial gauge would use for its dial alone.

  1. Value and unit, in tabular figures so digits do not shift.
  2. Position in the working range.
  3. Warning and critical thresholds.

Kept

  • Hairline panels
  • Grouped left navigation
  • One status badge per table row
  • Persistent vehicle identity
  • One number with one unit per instrument

Left out

  • Maps
  • Vehicle renders
  • Isometric scenes
  • Glass panels
  • Saturated tile fills
  • Radial gauges
What we took from six reference shots and what we left out.

One stream of frames feeds every screen

Before building screens we fixed the path the data takes and wrote it into a contract: the wire format, the key schedule, the messages, and the interfaces between the parts. With the contract in place, the protocol, the session layer, the console, the relay and the Windows agent were built in parallel against it.

The path never changes. The simulator produces vehicle bus frames. They are encoded as J1939 bytes, encrypted into records, sent, decrypted and decoded, and only then drawn. The instruments, the trend plots and the raw frame table are three views of the same decoded frames.

In the preview, the vehicle side and the technician side are two Web Workers in your browser with separate keys, joined by a link that carries only ciphertext. With the relay, the same two sides run on different machines.

The single data path. In the preview both sides run in your browser; with the relay they run on separate machines. The link between them only ever carries encrypted records. Redrawn from the project's architecture document.

A session starts at the vehicle. It creates an invitation: a link with a secret in its fragment, a QR code and a six digit pairing code. The technician opens the link and enters the code, and the two sides run a four message handshake. The console reports “Session secured” only after each side has verified the other. An invitation works once and expires after 15 minutes.

Retrospective reconstruction. How a session is created, shared and joined, drawn from the security notes.

The write workflow is a state machine. One block is in flight at a time, and progress advances only when the virtual ECM acknowledges a block it has verified by SHA-256. The ECM keeps its current image until the new one is complete and its full hash matches.

The write workflow as built. A lost link leads to a resume from the last verified block. This recovery is a property of the virtual ECM; a real controller's behavior depends on its bootloader. Redrawn from the project's architecture document.
Retrospective reconstruction. The console's seven destinations and the Live data layout, drawn from the design document.

Building it

Simulator and codec

The simulator is a deterministic truck: the same seed produces the same frames, across five scenarios from a drive cycle to stationary programming. The codec encodes and decodes seven J1939 messages, and its tests include byte sequences published in public J1939 references. One of them: identifier 0x0CF00401 with data FF FF FF 68 13 FF FF FF must decode to 621 rpm. Raw values that mean “not available” or “error” never render as numbers.

ID    0x0CF00401Data  FF FF FF 68 13 FF FF FF0x1368 x 0.125 rpm per bit = 621 rpm
An engine speed frame from a public J1939 tutorial, used as a test fixture. Bytes 4 and 5 carry the value.

Live readings

Four range instruments, four trend plots on one time axis, and the raw frames behind them. Numerals update five times a second with no count-up animation, set in tabular figures so a value does not shift sideways when a digit changes.

Faults

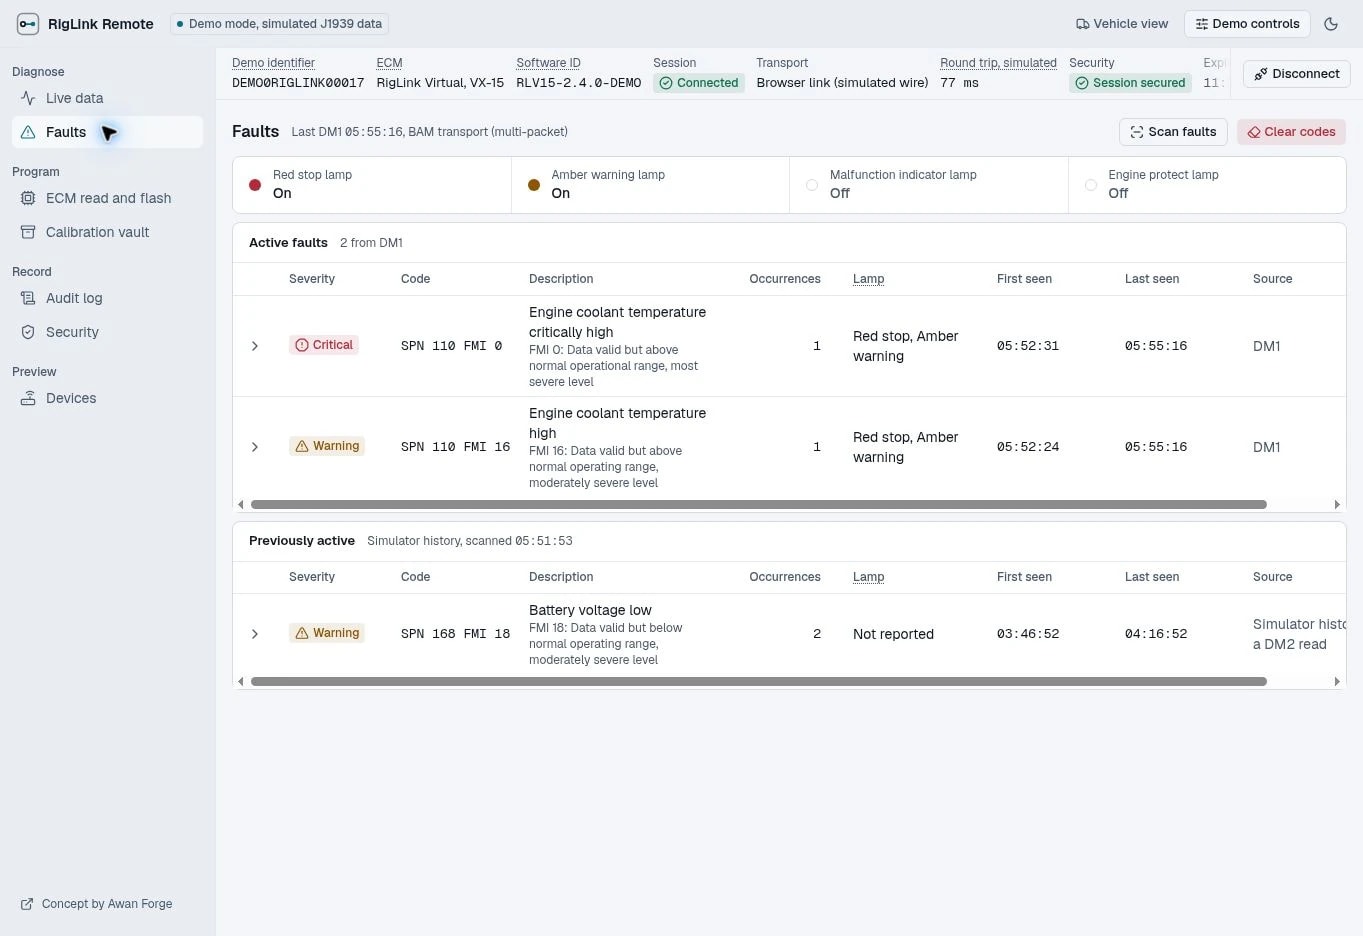
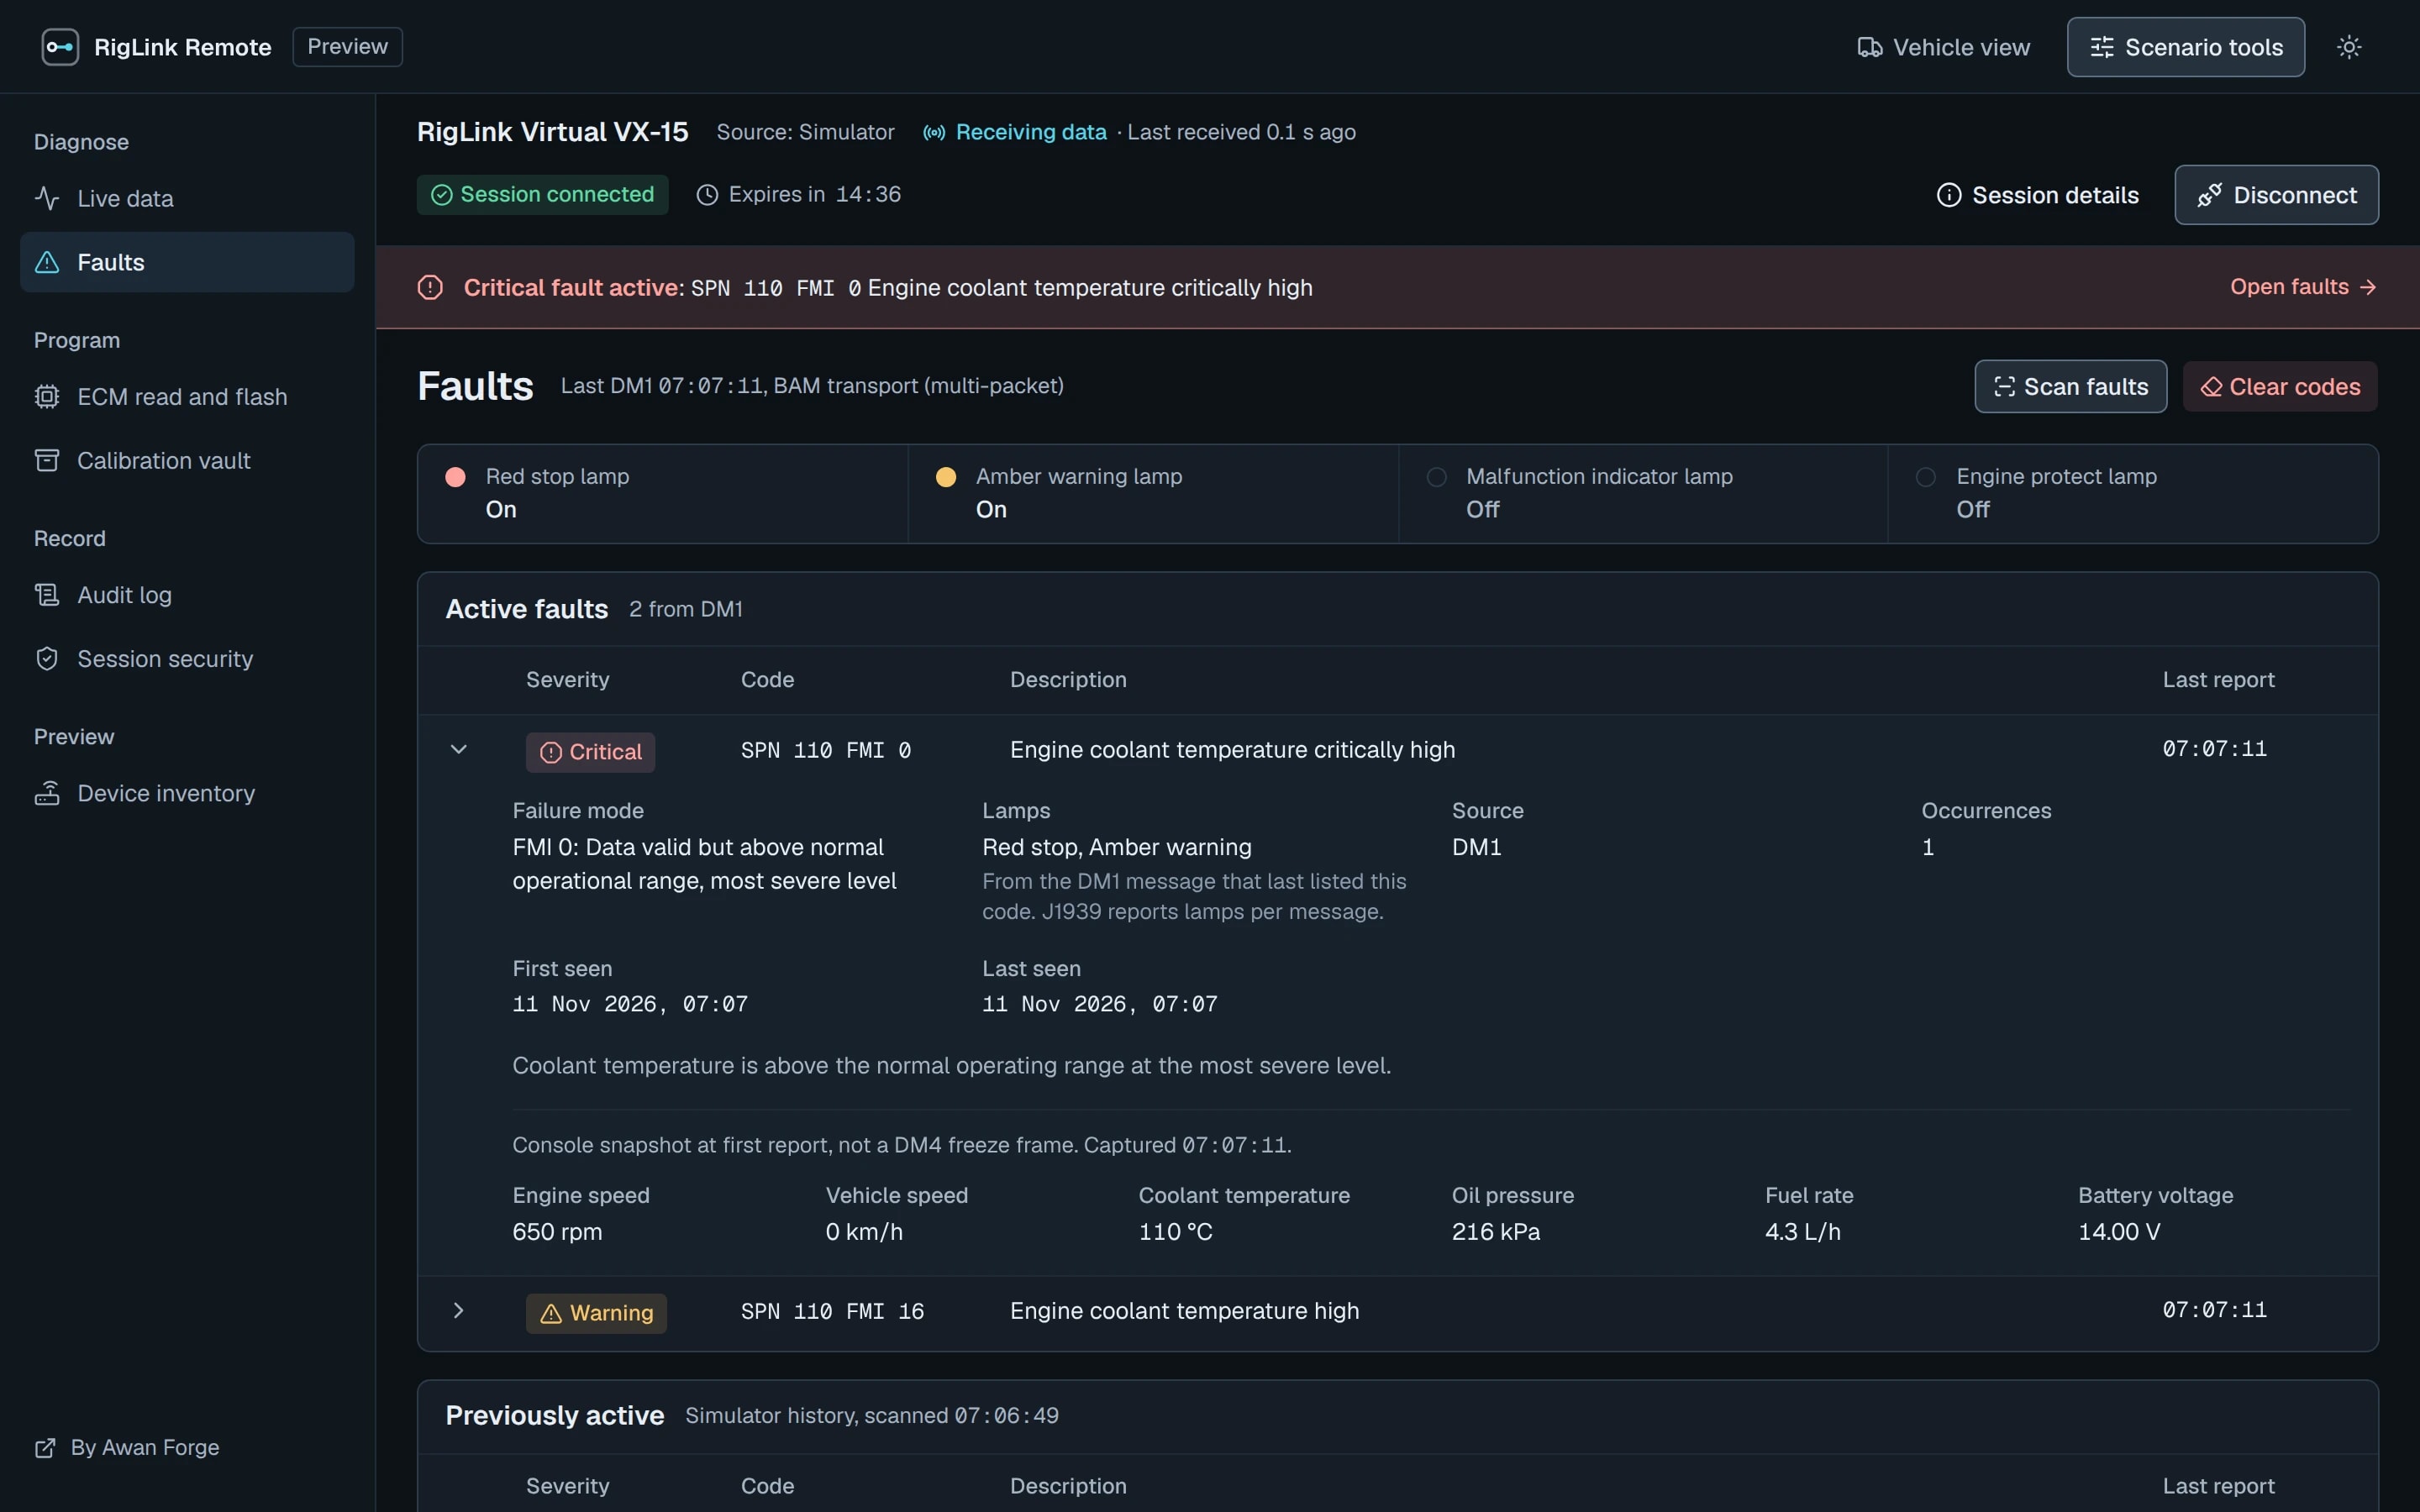
Switching on the coolant fault scenario raises coolant temperature until the engine reports two trouble codes. Two codes do not fit in one CAN frame, so the report travels over J1939's multi-packet transport, and the raw frame table shows those transport frames. Clear codes sends a real request and receives a real acknowledgment. The fault then returns, because the condition is still there.

Faults screen with red stop and amber warning lamps on and two active faults for engine coolant temperature, one critical and one warning.

Two active coolant faults, reported by the simulated engine over the multi-packet transport. Clearing the codes is acknowledged, and they return while the engine is still hot.

  1. Lamp states decoded from the same fault report.
  2. SPN 110, the coolant temperature signal, with its failure mode.
  3. Sends a real request. Asks for confirmation first.

Calibration vault

Calibration files in the preview are synthetic, with real bytes, sizes and SHA-256 hashes. The vault stores them encrypted in the browser, compares a file against the image in the ECM, and exports to a passphrase-encrypted file.

ECM read and write

A read copies the image in 256 verified blocks and files it in the vault with its hash. A write starts with prechecks that read live telemetry: while the truck is moving they fail, show the measured value against its limit, and keep the start button disabled. Starting takes a confirmation that names the file and the target, with focus on Cancel.

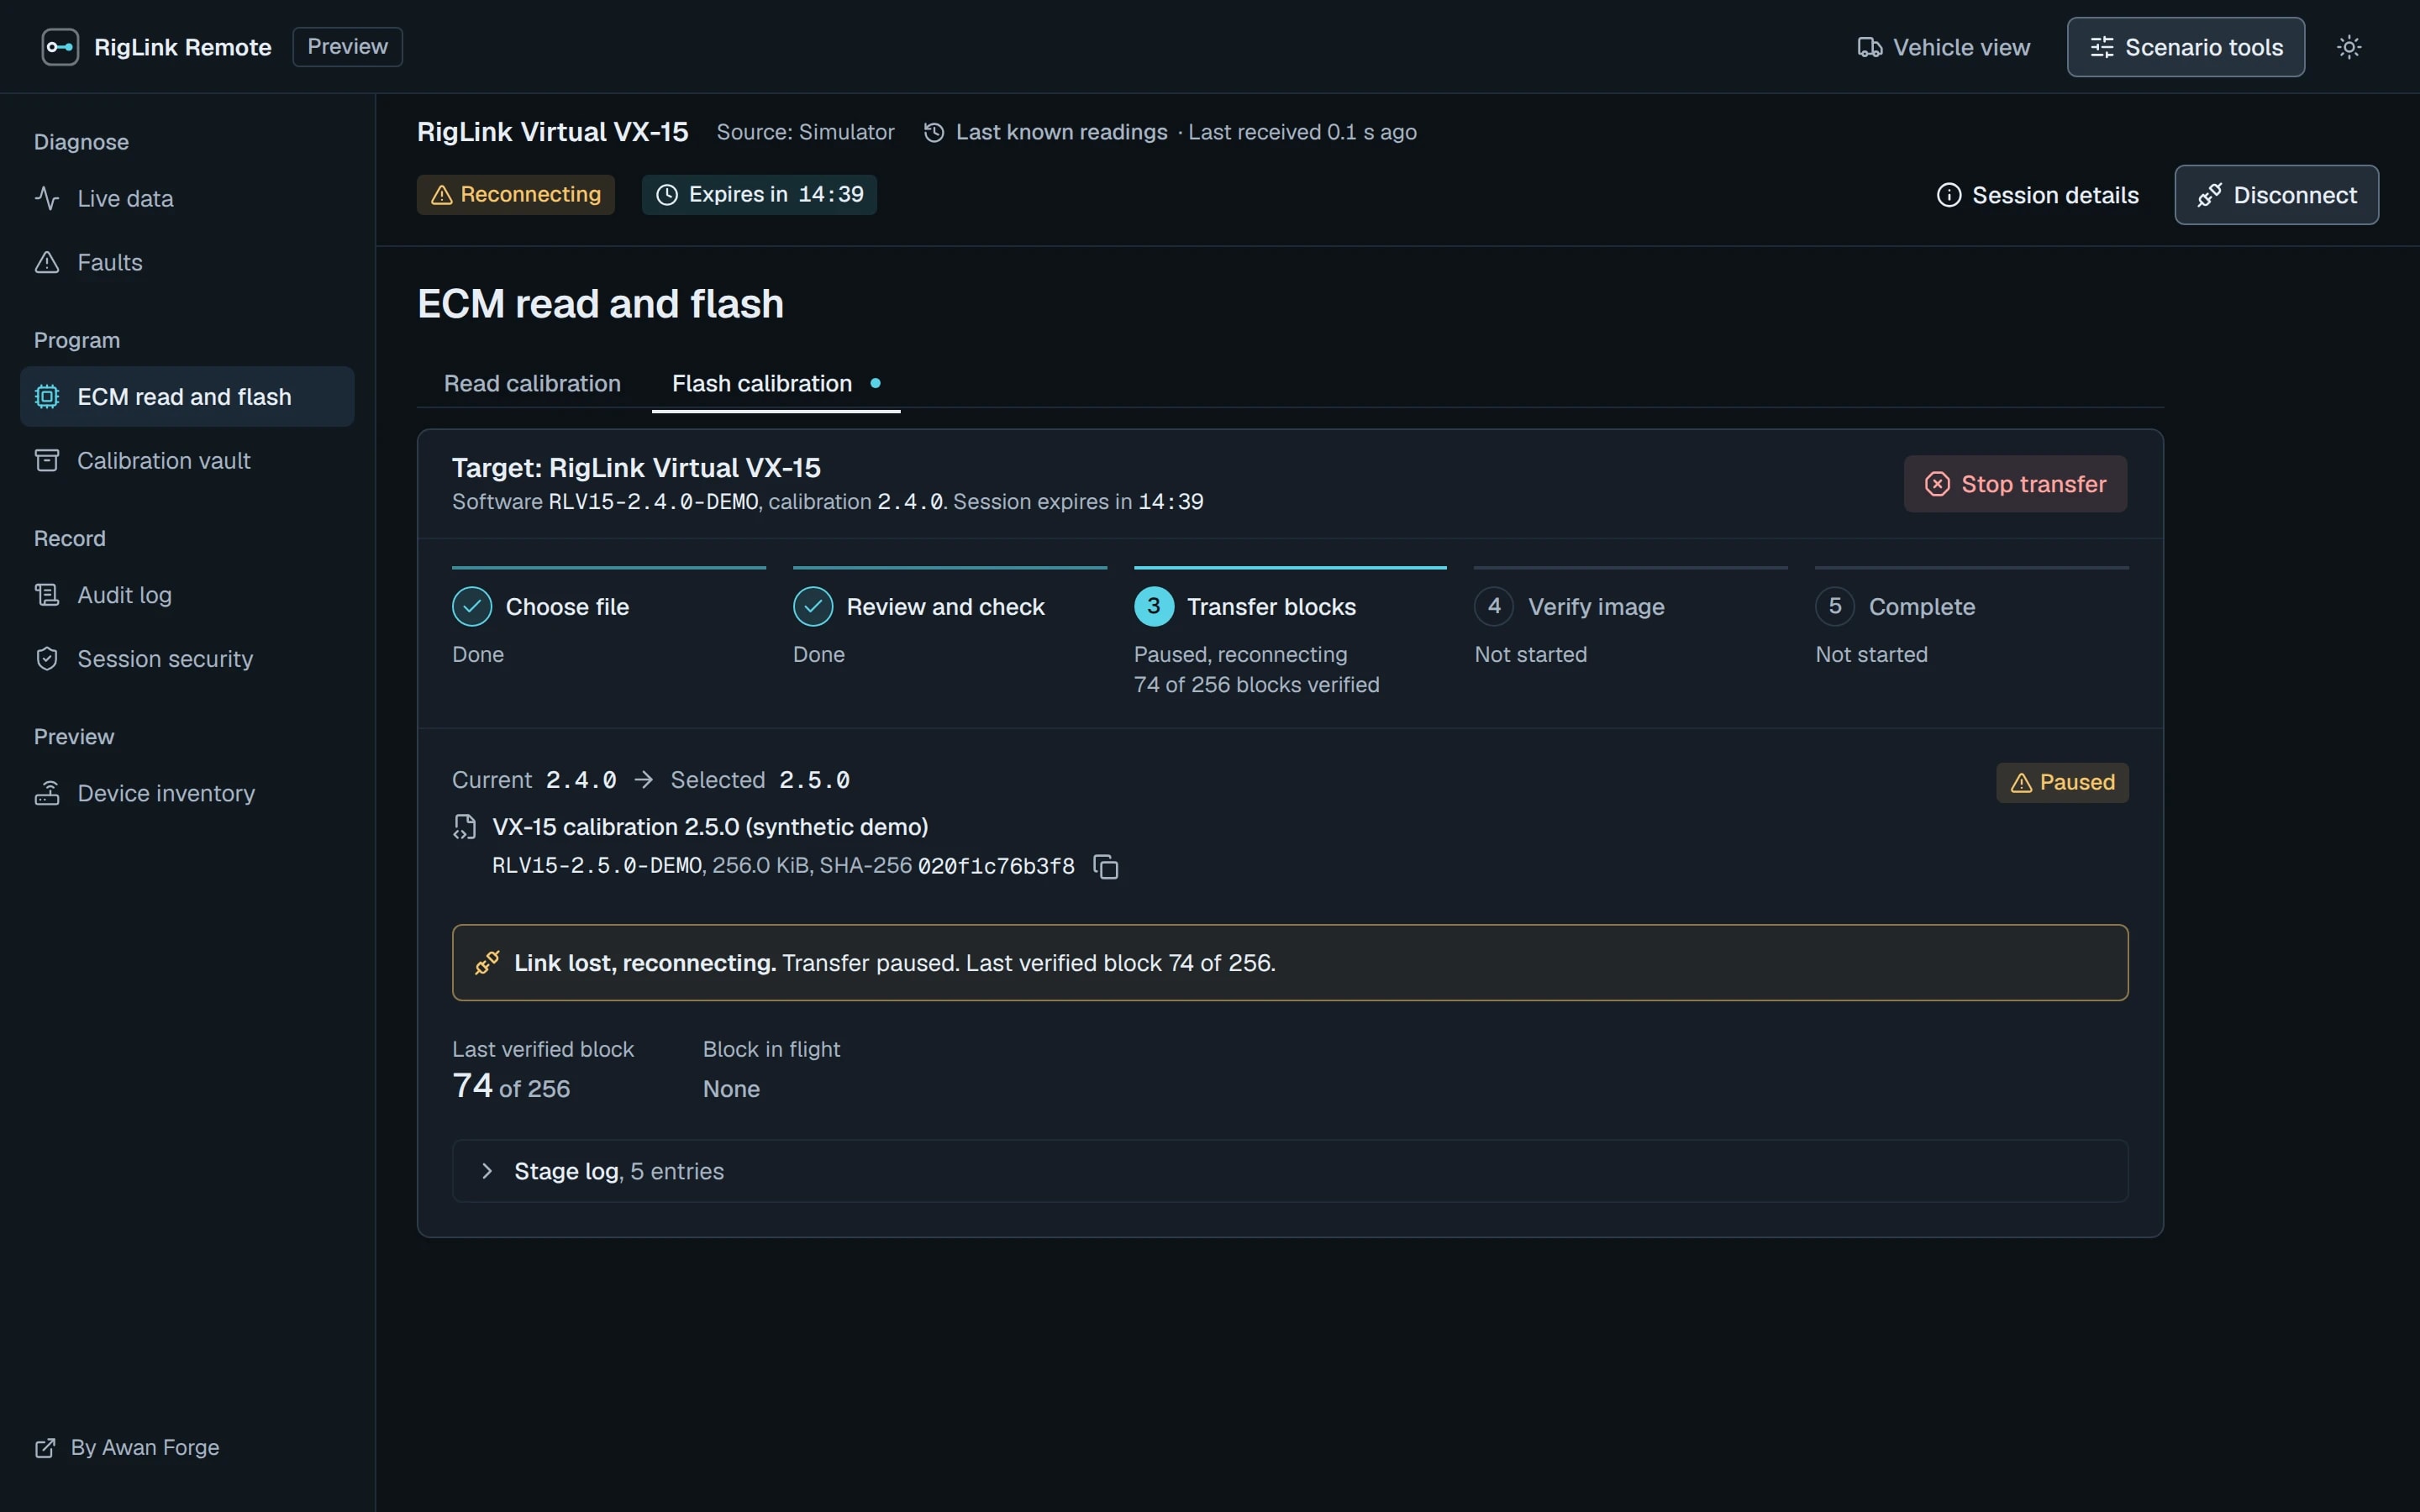
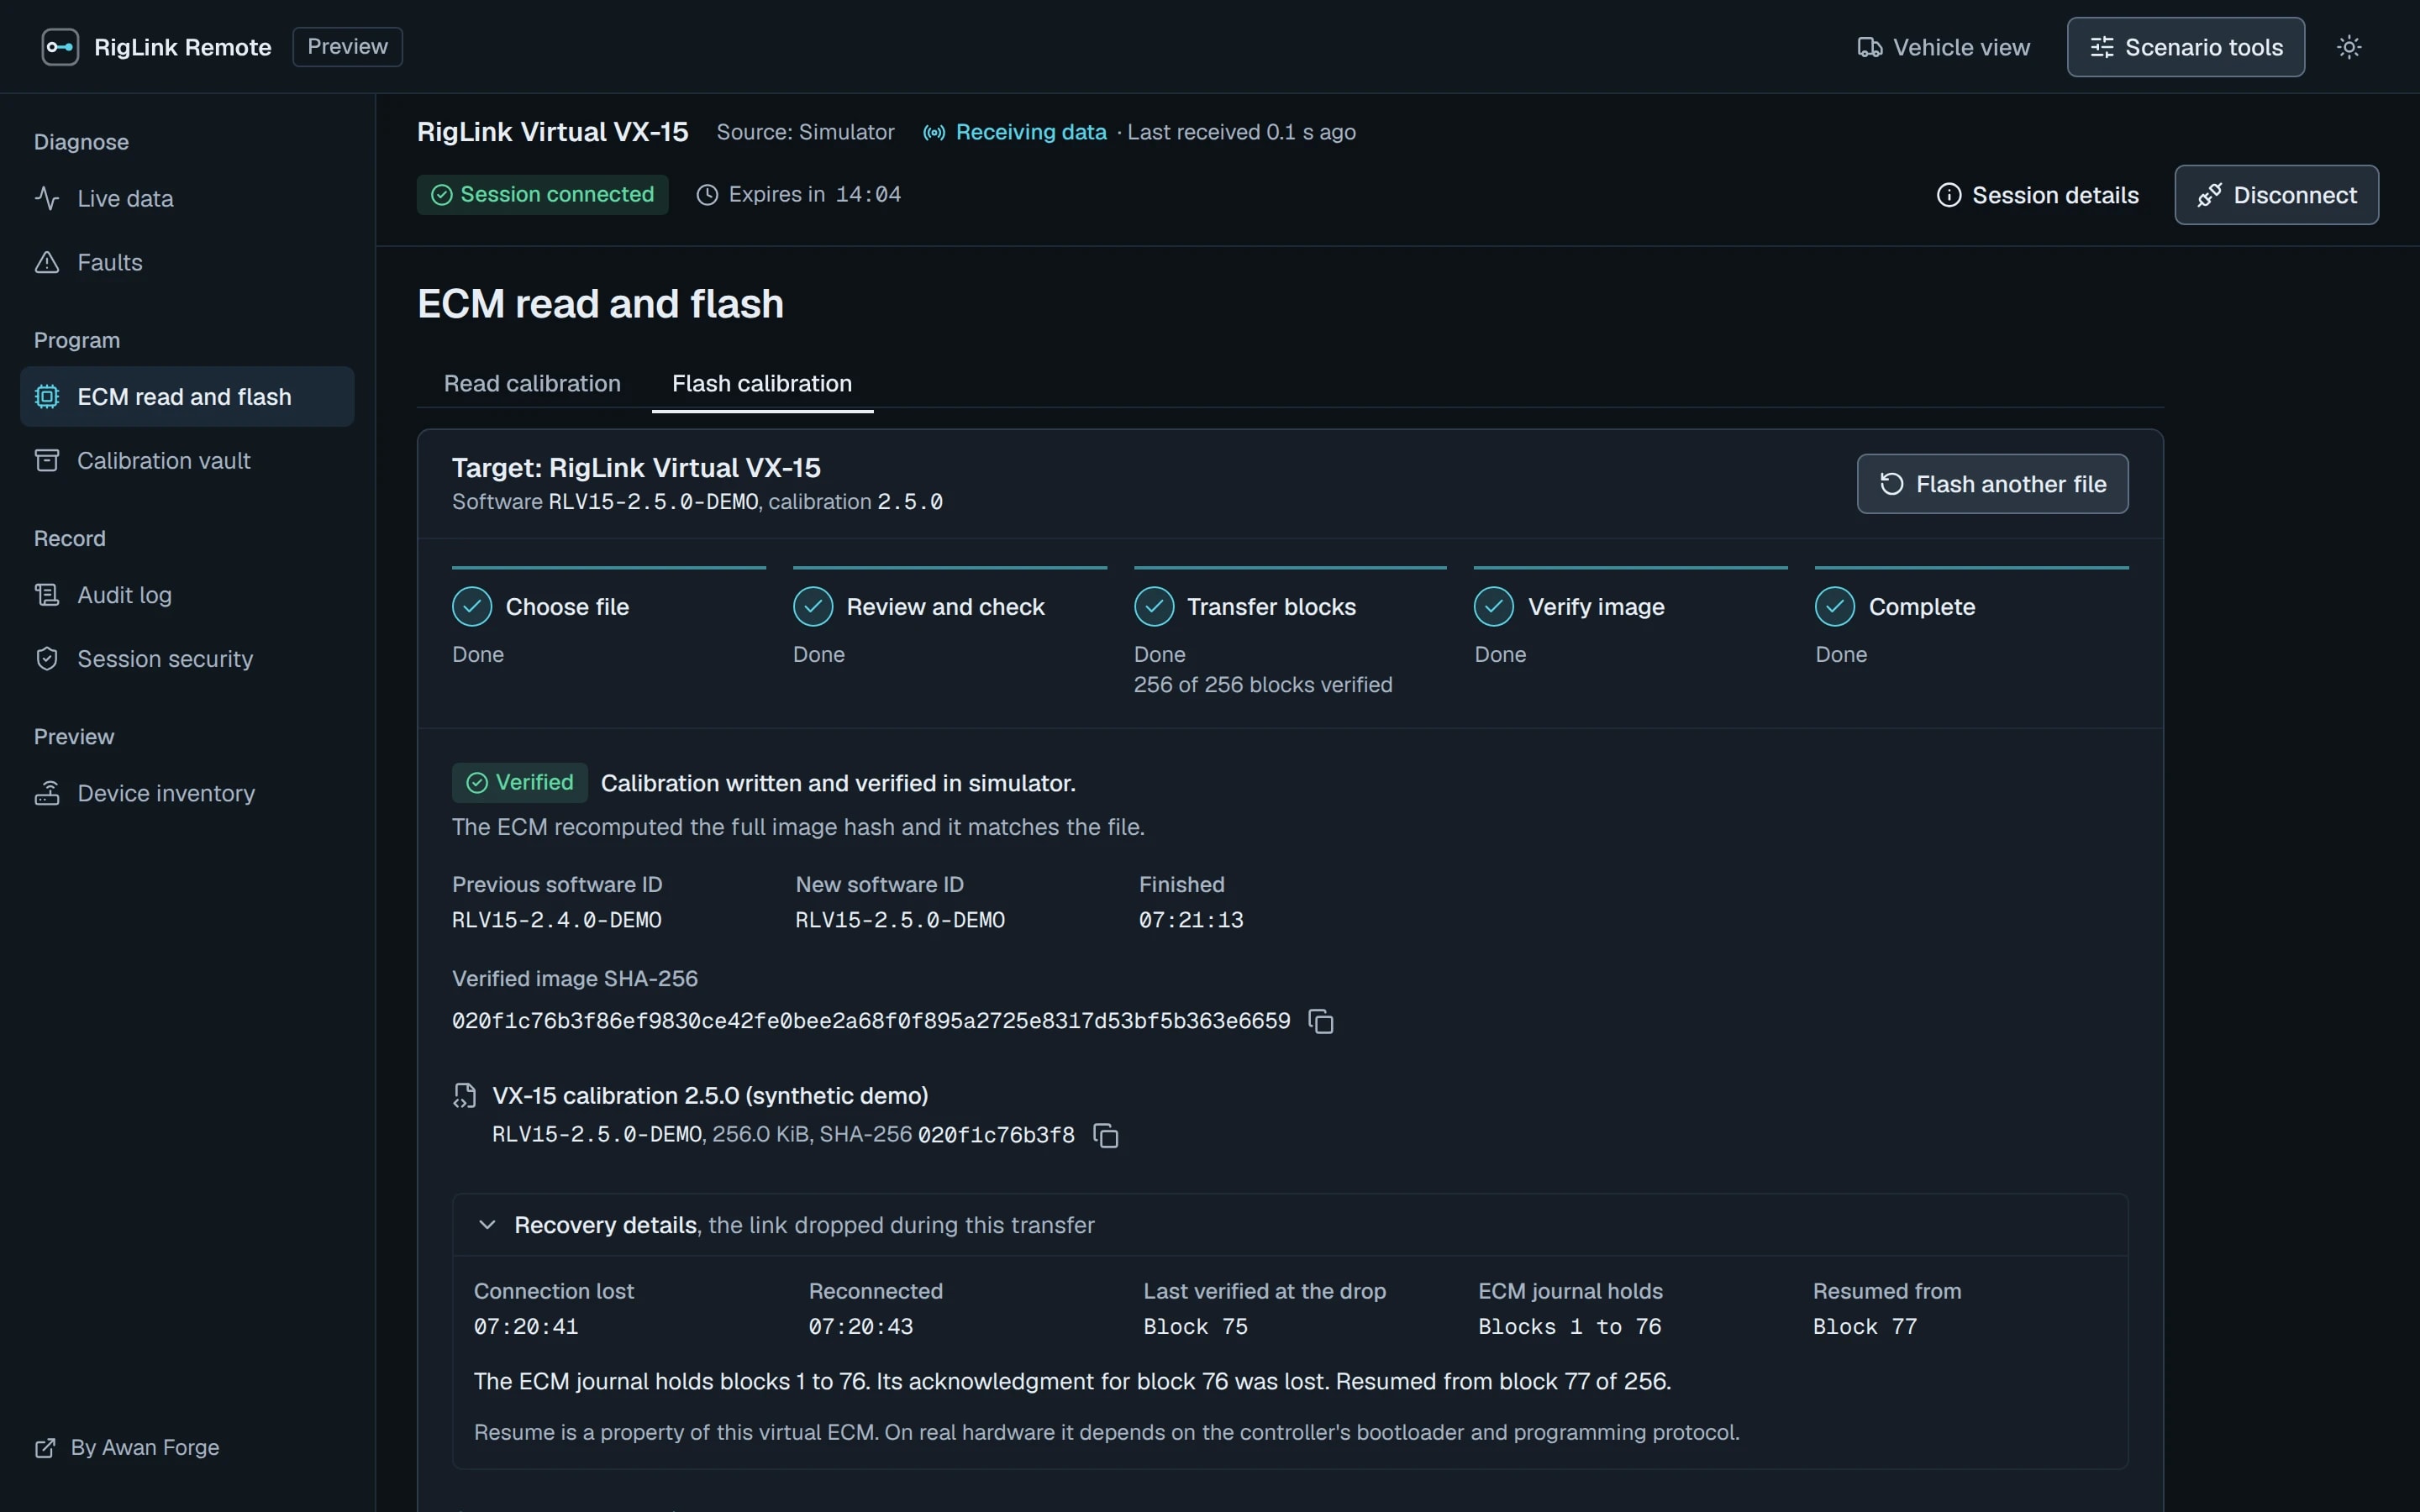
The virtual ECM records each verified block in a transfer journal. When the link drops, the screen holds at the last verified block. The session resumes with new keys, the console asks the ECM what its journal holds, and the transfer continues from the next block. It ends with a hash check of the full image. After a page reload in the middle of a transfer, the console offers the interrupted transfer and continues from the journal.

256

blocks in a calibration read, each verified by SHA-256

262,144

bytes in a calibration read

ECM write screen in a paused state showing the last verified block, a reconnecting status and a recovery panel saying the link was lost.

The link has dropped in the middle of a write. The transfer holds at the last block the ECM verified and waits for the session to resume.

  1. Progress only counts blocks the ECM has verified.
  2. The same state shows on every console screen.
  3. What was lost, when, and where the transfer will resume.
  4. The ECM keeps its current calibration until a new one is fully verified.
ECM write screen after recovery: every stage done, a Verified result with the full image hash, and the recovery details showing the block the transfer resumed from.

After the session resumed with new keys, the transfer continued from the next block and finished with a hash check of the full image.

Encrypted session

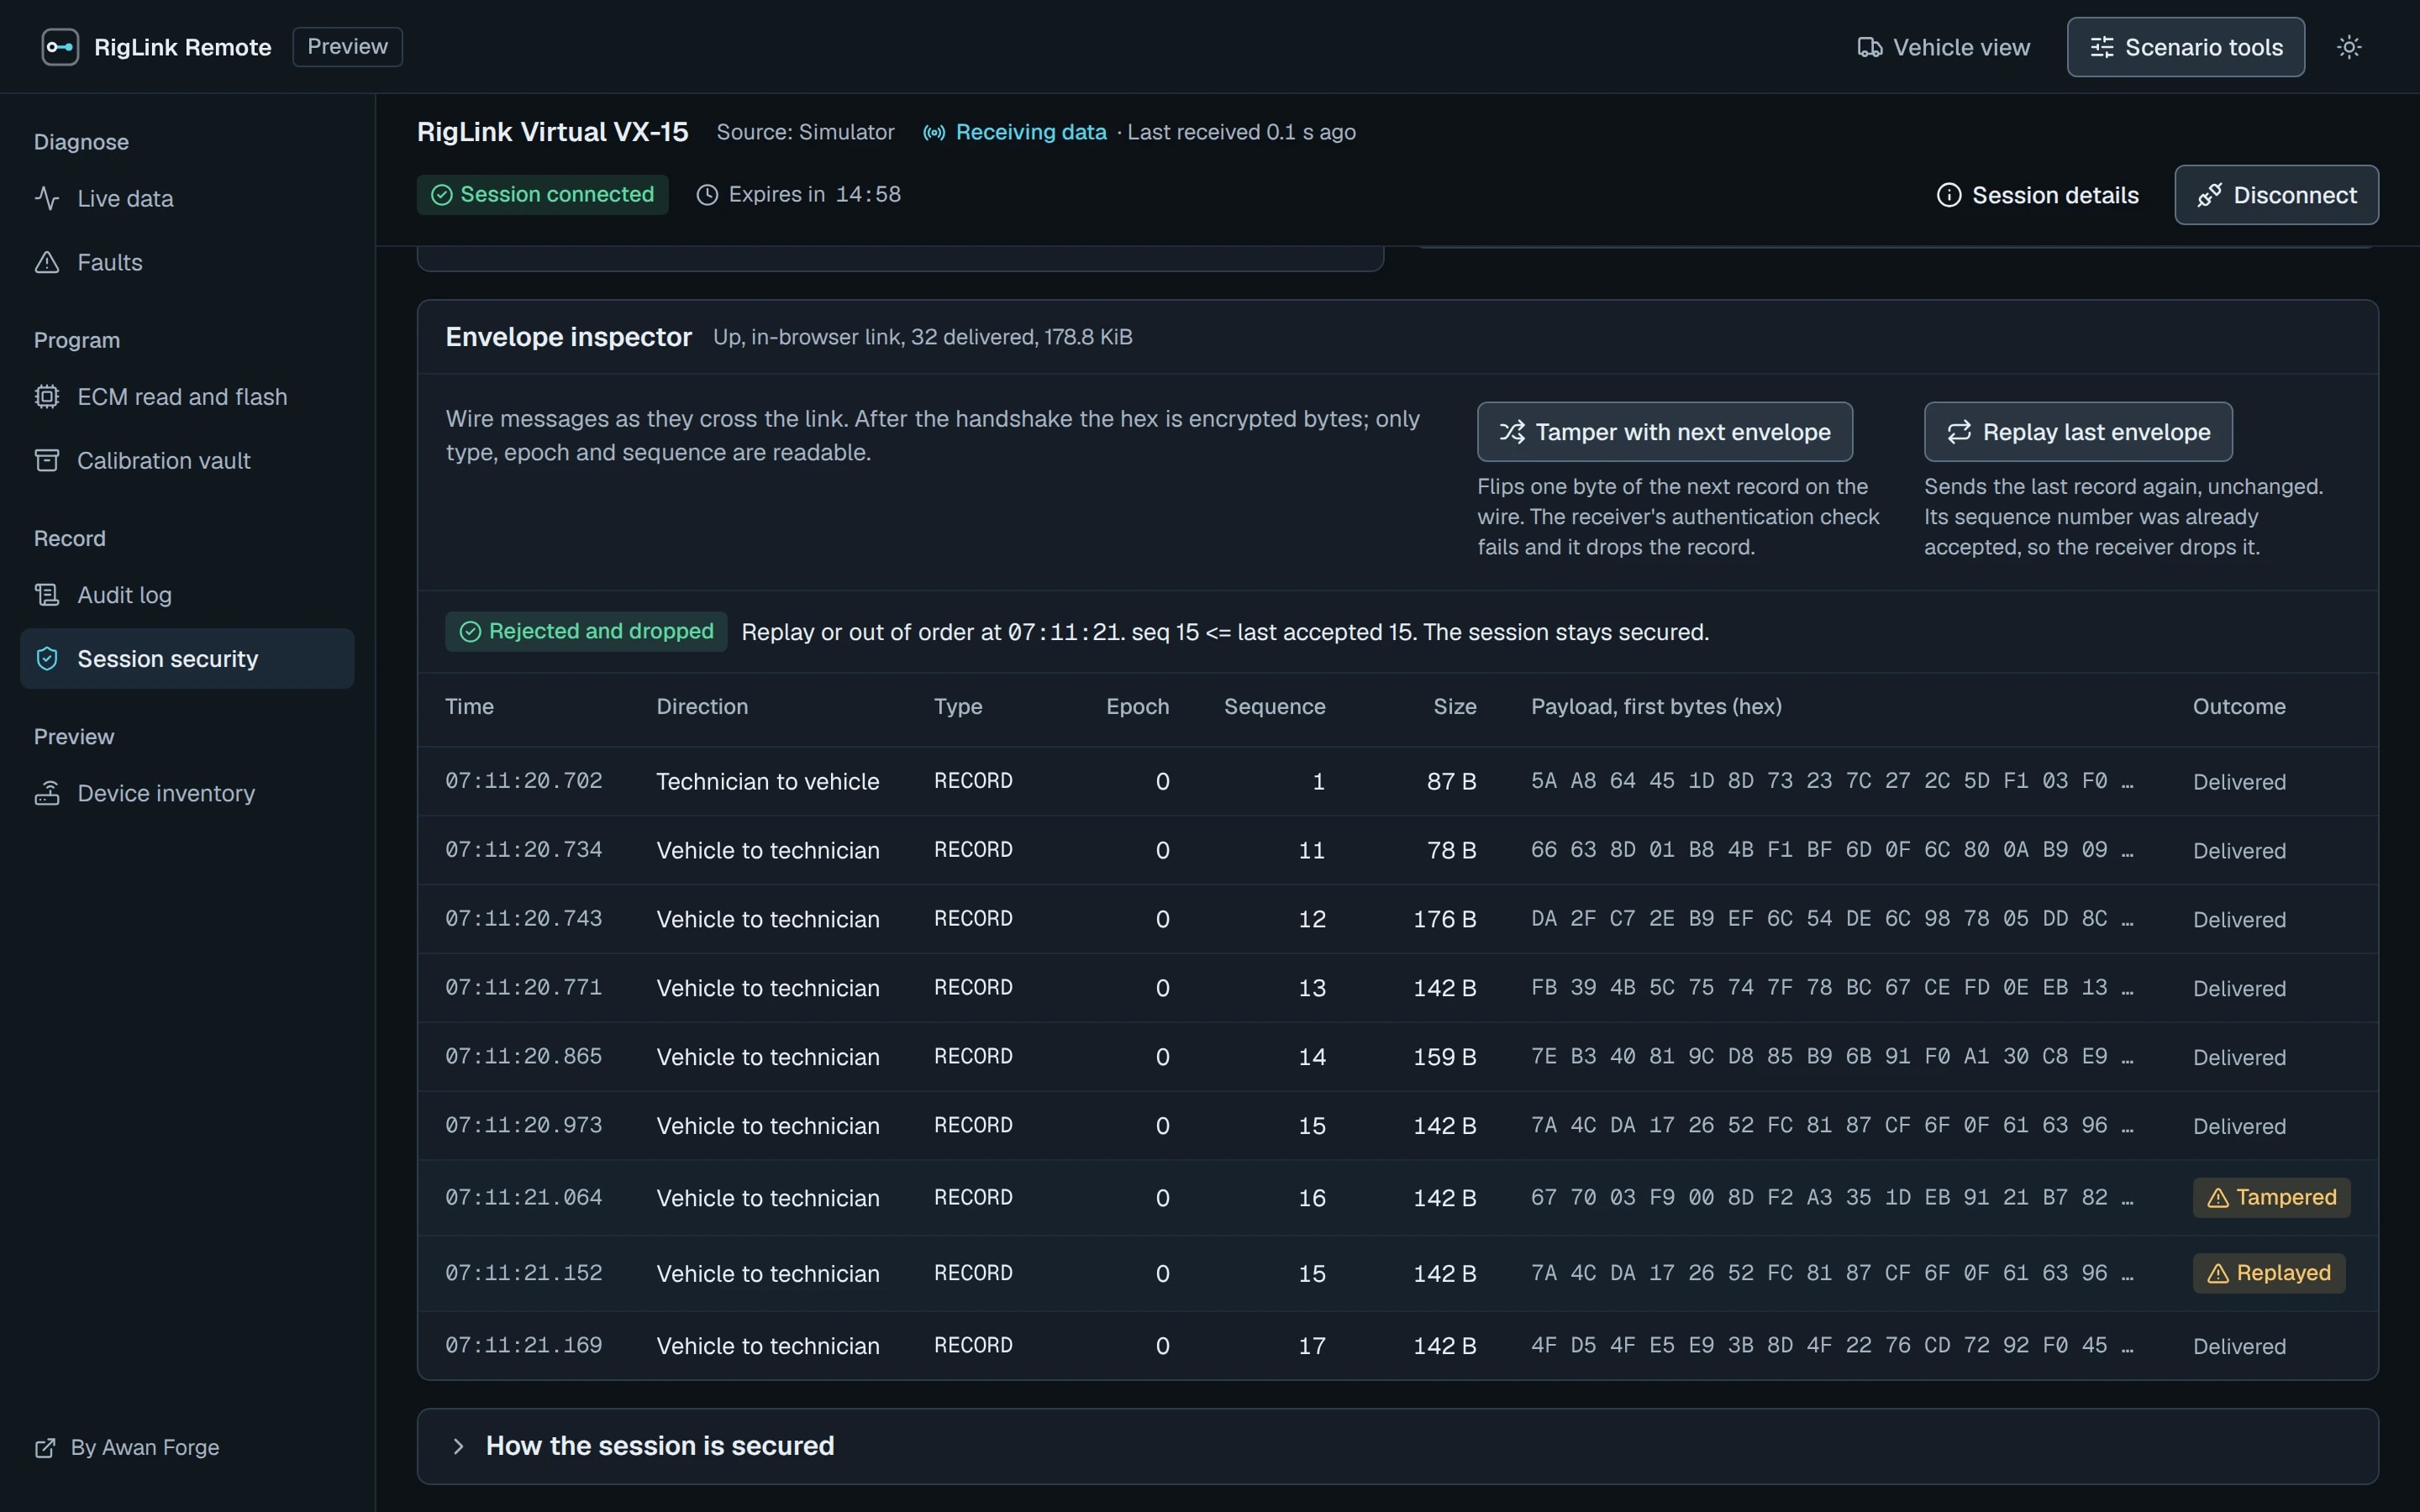
Every application message is an AES-256-GCM record, under keys from an ephemeral P-256 key exchange that is repeated on every reconnect. A record with a failed authentication check or a repeated sequence number is rejected, counted and dropped. The Session security screen shows the handshake and the bytes on the link, and has two test buttons, one that tampers with a record and one that replays a record, so a visitor can watch both get rejected.

Session security screen with the envelope inspector: Tamper and Replay buttons above a table of encrypted records, two of them marked Tampered and Replayed, while the session stays connected.

The Session security screen lists the encrypted records crossing the link. The two test actions produce rejected rows while the session stays secured.

  1. Tamper with the next record, or send the last one again.
  2. Rejected, counted and dropped. The reason is stated.

Relay and Windows agent

The relay is one Node process that pairs a vehicle with a technician and forwards ciphertext. It never holds a key. The Windows agent is a C# application that speaks the same protocol. Both implementations check the same test vectors, and an automated run has the C# agent and the TypeScript endpoint complete a handshake, exchange frames, clear codes, read a calibration with a matching hash, and resume from both sides.

Hardware

The agent keeps adapter access, protocol decoding, session transport and ECM programming apart, so a real adapter can replace the simulated one without changes to the session or the console. Its RP1210 adapter is written from public documentation and has never loaded a driver. Programming a real controller is disabled in every build.

RigLink Remote is an Awan Forge product concept with a working interactive preview. Diagnostics and ECM programming run against a simulator. Real vehicle support is not released.

What changed, and why

8

findings from the independent security review: 2 medium, 6 low

7 of 8

fixed; 1 recorded as a known limit

  • The virtual ECM trusted the console

    An independent security review, run separately from the implementation, reported eight confirmed findings: two medium and six low. We fixed seven. The eighth is recorded as a known limit: the static site's content security policy allows inline script. In one finding, the virtual ECM relied on the console to behave, so a modified client could send it anything. The ECM now re-checks its programming conditions on every block and before committing, verifies the image against the transfer manifest, and takes its new identity from the verified image.

  • The relay's session table could be filled

    In another finding, one client could fill the relay's table of sessions. A session that no vehicle claims is now removed after 60 seconds, and each address is limited to 10 live sessions and 8 connections waiting for admission. The limit that remains is written down: a client with many addresses can still fill the table for as long as it keeps claiming sessions.

  • A limit we accepted

    The six digit pairing code can be guessed offline by an attacker who already holds the invitation link and can pose as the vehicle. Closing that gap needs a password-authenticated key exchange, which the browser's Web Crypto API does not provide. We accepted the limit for the preview and wrote it into the security notes, along with what a production version would use.

  • A regression the tests missed

    The new input validation from the security fixes rejected the seeded fault history entry. We found it by looking at screenshots of the running application, then fixed it and added a regression test.

  • Two timing-sensitive tests

    One end-to-end test asserted that every table row matched a filter, which an empty table satisfies. Another left the pointer resting on one pixel, which kept a stale tooltip on screen. We fixed both without loosening an assertion, and they passed ten repeats out of ten. After the redesign, the trend tooltip check failed once in four full runs, so we record it as intermittent.

  • Two failed deploys

    The first deployment failed twice. The relay service pointed at a Node binary that its restricted service account could not execute, so the deploy script now installs a private copy. Then the script's live checks ran while the web server was still reloading and reported a failure for a site that came up seconds later. The checks now retry.

  • A runtime that went out of support

    .NET 8 reached end of support on 10 November 2026, while this work was under way. The agent still builds for .NET 8, the target it was specified with, and also for .NET 10, which is supported until November 2028. The documentation says which build to use.

A design review of the first version

The first version went live on 11 November 2026. A design review of it, written the same day, inspected ten screens in the running preview and listed twelve issues by priority. Its verdict: the workflows were sound, and the interface spread attention too evenly. We treated the review as binding and rebuilt the interface around it.

The review also listed what to keep: the Diagnose, Program and Record groups, the four core measurements, separate trend scales, the fault descriptions and the recovery details. Those are unchanged.

Readings that looked live after the session ended

Before: after Disconnect, the last readings stayed on screen in their live styling, and the frame counter still read 35.0 frames per second.

After: the moment a session is not secured, every reading is marked “Last known” with its age, the frame rate reads 0, and the trend stops at its last real sample. While a session is connected, a reading older than three times its expected interval is flagged by a timer, so the warning does not wait for a frame that may never arrive. A missing value is shown as a word, never as zero.

First version
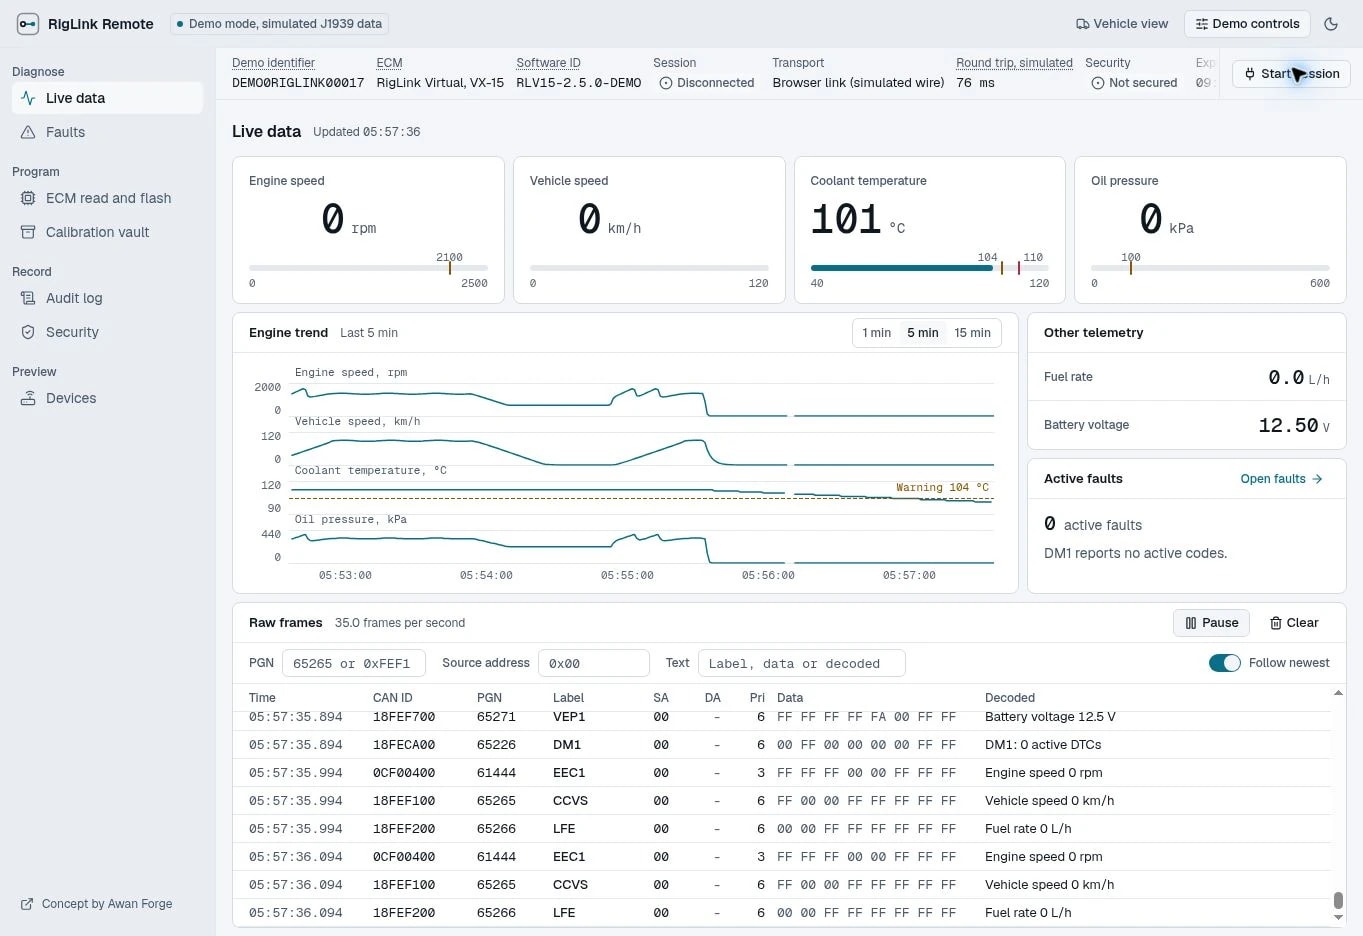
First version of the Live data screen in a disconnected state, still showing 101 degrees coolant temperature and 35.0 frames per second with no stale label.

After Disconnect, the session has ended, and the readings and the frame rate still look current.

  1. The session has ended.
  2. The reading keeps its live styling, with no age.
  3. The frame rate is from before the disconnect.
  4. A clock time, with nothing to say it has stopped.

After the review
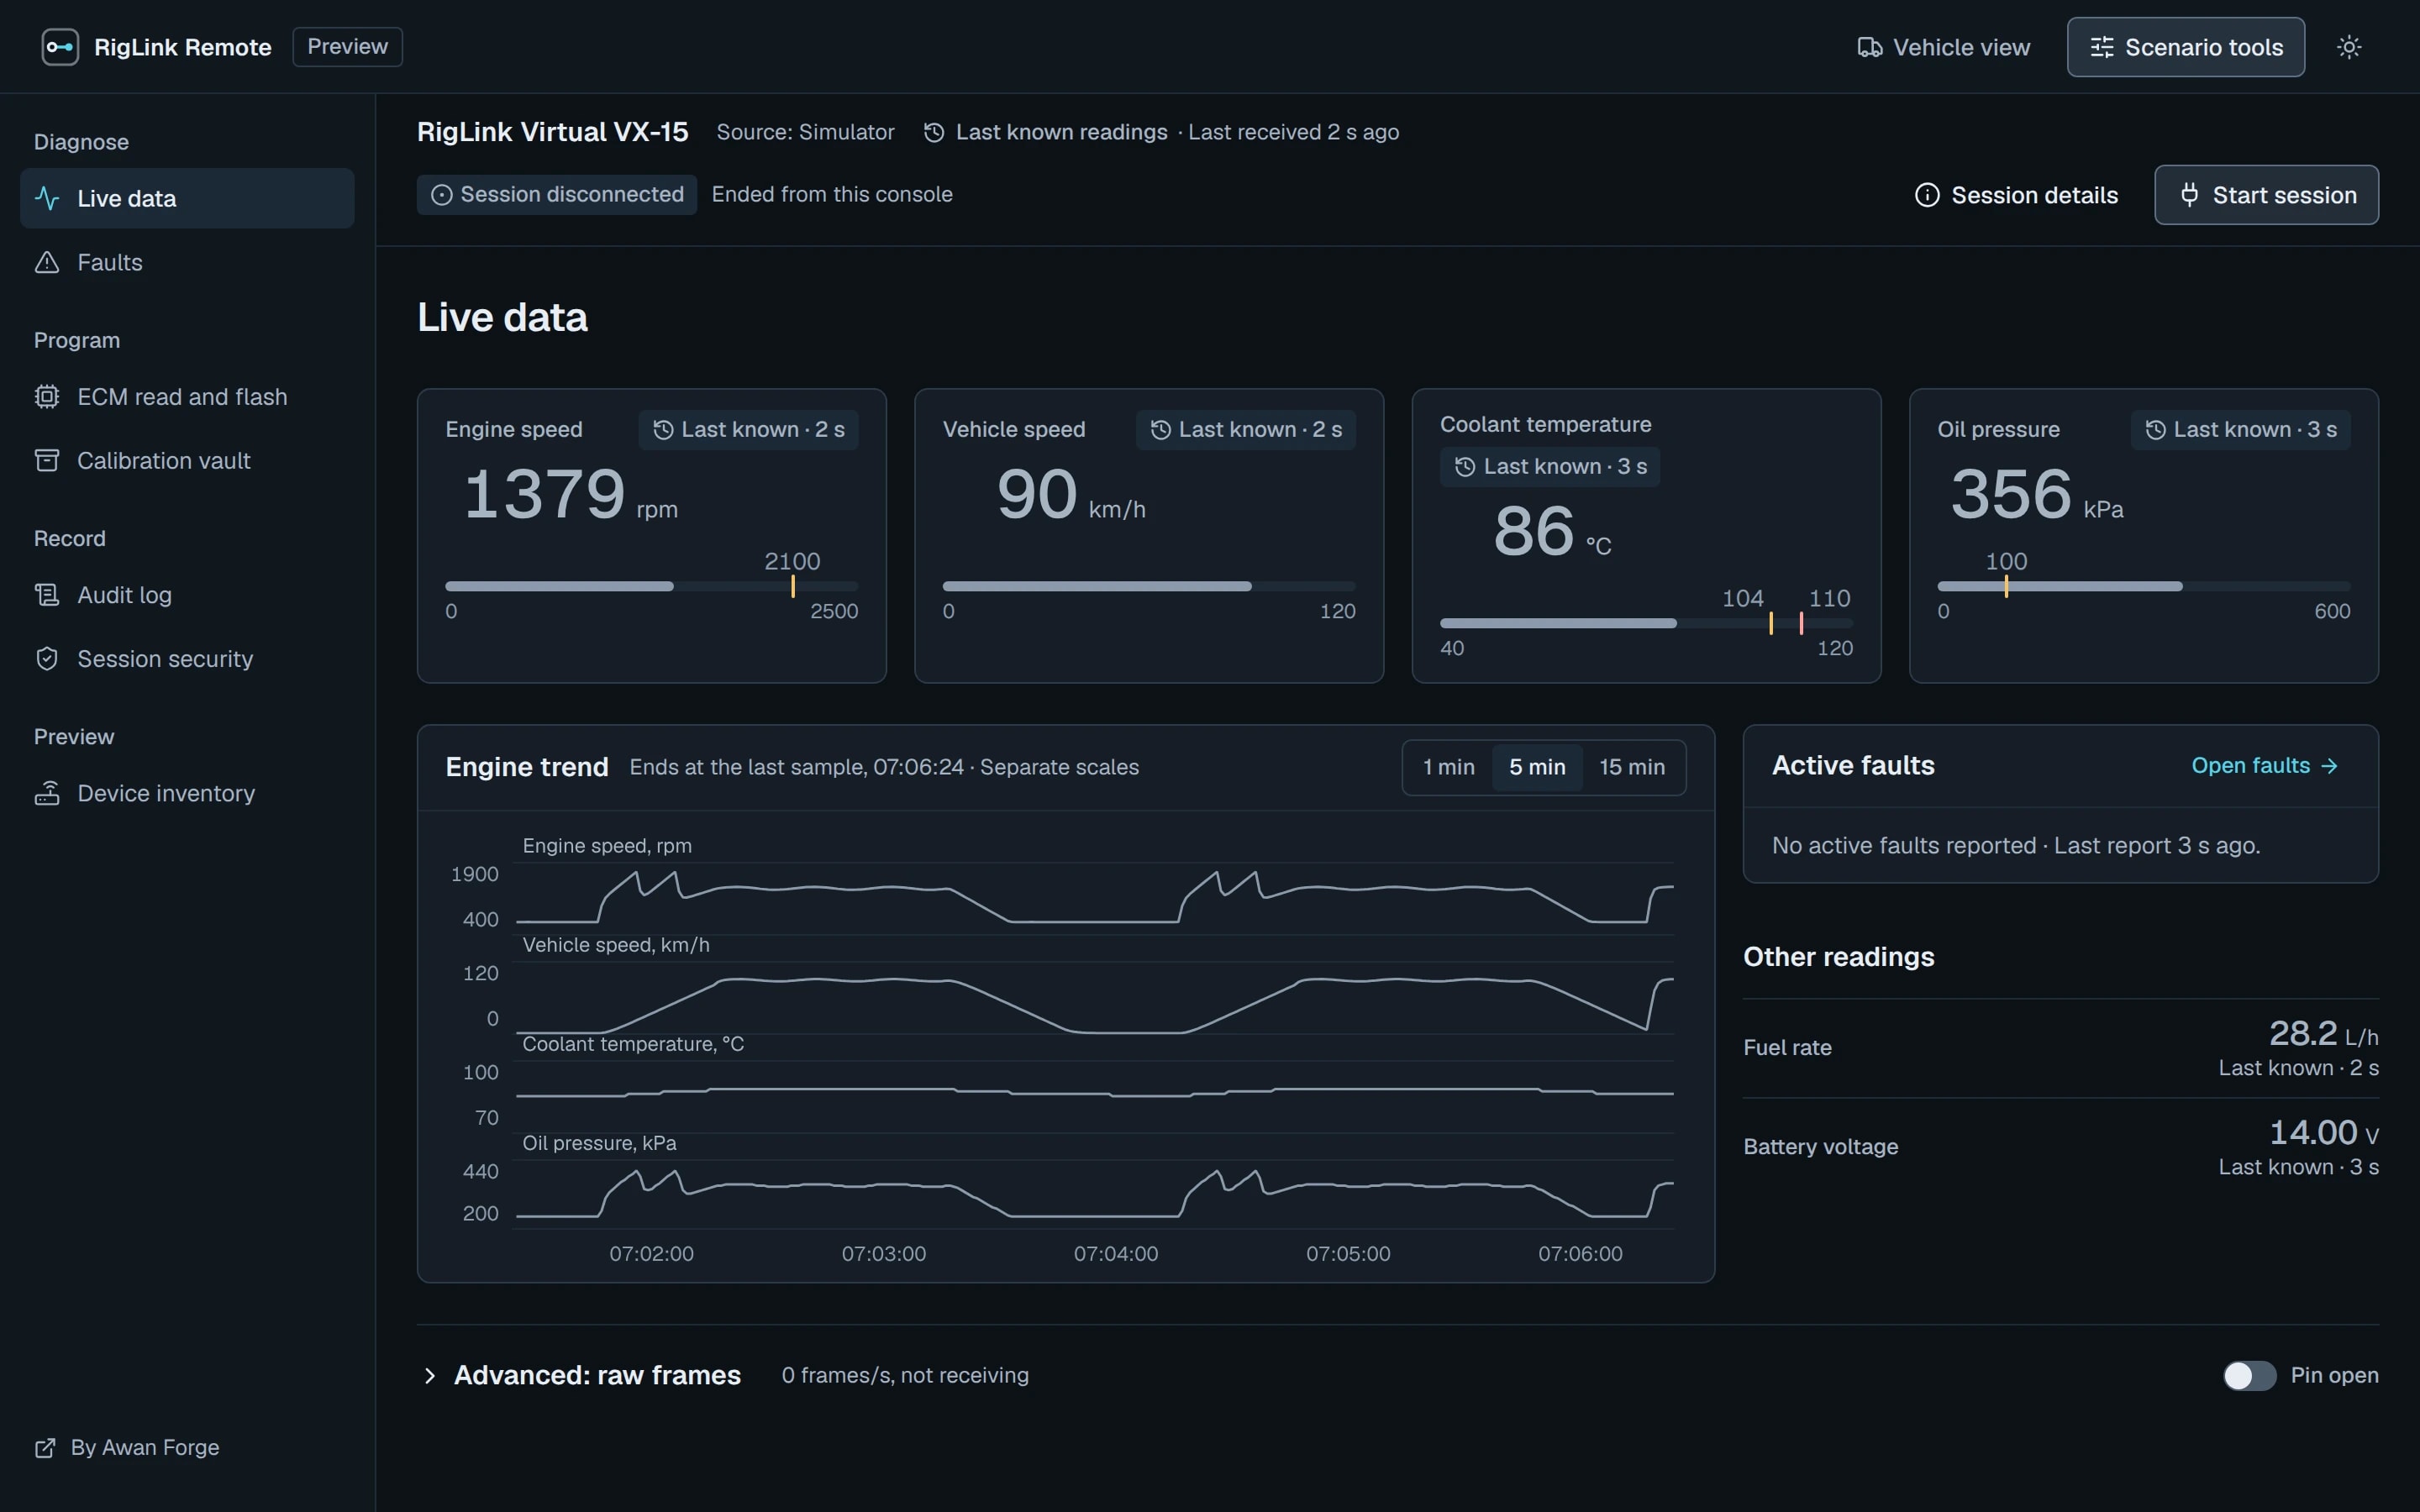
Redesigned Live data screen after a disconnect, with the session context reading Session disconnected and each instrument labeled Last known with its age.

After Disconnect, every reading is marked as last known, with its age.

  1. Session disconnected. Last known readings.
  2. Last known, with its age. The live accent is gone.
  3. The trend ends at the last real sample.
  4. The frame rate reads 0.

A session bar that cut off its last field

Before: eight fields shared one row. At the width the review used, the expiry time was cut off.

After: two rows that wrap. The first holds the target, the data source and how fresh the data is. The second holds the session state, the expiry, Session details and Disconnect. Identifiers and transport facts moved into Session details. The expiry is promoted during a transfer and when fewer than five minutes remain.

First version

First version session strip with eight fields in one row and the expiry field clipped at the right edge.

The last field, the session expiry, is cut off before the Disconnect button.

  1. Expiry, cut off.

After the review

Redesigned session context in two rows: target, source and data freshness above; session state, expiry, session details and disconnect below.

Two rows that wrap at any width, with freshness in the first row.

  1. Receiving data, with the time since the last frame.
  2. Always at the right end of the second row.

Type that was too small to orient by, and raw frames that led the screen

Before: page titles were 16 px, panel headings 13 px and most metadata 12 px. The raw frame table took about the bottom third of the first console screen.

After: page titles are 24 px, panel headings 16 px, controls and table text 14 px and metadata 13 px. Only chart ticks remain at 12 px. Raw frames are a collapsed section named “Advanced: raw frames” that shows the frame rate and the pause state. A technician who wants the table can pin it open, and the choice is remembered.

First version

First version of the Live data screen with four instruments, a trend panel and a raw frame table occupying the bottom third of the screen.

The page title is the same weight as a panel heading, and protocol detail fills the lower third.

  1. Page title, 16 px.
  2. Panel heading, 13 px.
  3. Raw frames take the bottom third.
  4. A scope label on every screen.

After the review

Redesigned Live data screen with a larger page title, four instruments, a trend beside an active faults summary, and a collapsed Advanced raw frames section.

A clear title, faults beside the trend, and raw frames one click away.

  1. 24 px.
  2. Faults sit beside the trend.
  3. Collapsed, with the frame rate. Pin open to keep it.
  4. Release label and data source, stated once each.

Tables wider than the screen

Before: the fault and device tables scrolled sideways, and the last columns were out of view.

After: the code, a readable description, the severity and the last report stay in view. The full failure mode text, lamp detail, source and other timestamps open in the row's details.

First version

First version of the Faults screen with two tables, each showing a horizontal scrollbar and a truncated last column.

Both fault tables need a horizontal scrollbar, and the Source column runs off the edge.

  1. The table is wider than its panel.
  2. The last column is cut off.
  3. The description is squeezed into a narrow column.

After the review

Redesigned Faults screen with fault rows that fit the panel width and an expanded row showing failure mode, lamp, source and timestamp details.

The columns a technician scans stay on screen; the rest is in the row details.

  1. No sideways scroll.
  2. Failure mode, lamps, source and timestamps, on demand.

A read screen split into a narrow column and an empty pane

Before: the read workspace was a narrow column of explanation and stages beside a large transfer pane that stayed mostly empty. The write setup ran as one long page.

After: a read is one workflow card with the target and the action at the top, the stages in a row, then the transfer area. A write is three steps: choose a file, review the target and the checks, transfer.

First version

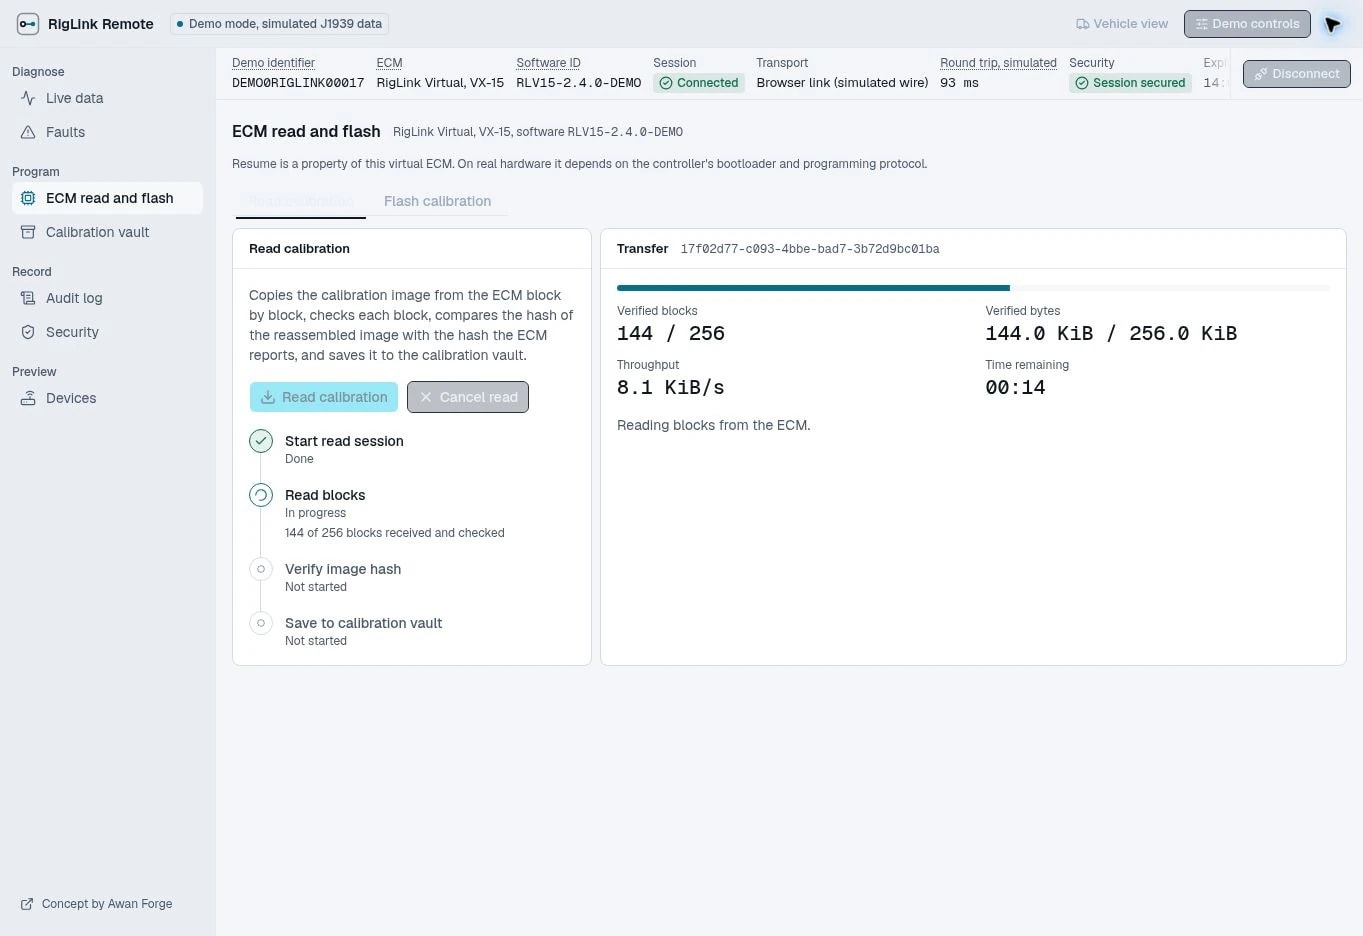
First version of the ECM read screen with a narrow column of explanation and stages on the left and a mostly empty transfer panel on the right showing 144 of 256 blocks.

A read in progress. The figures that matter occupy a corner of a large empty pane.

  1. Explanation and stages share a narrow column.
  2. Most of the working area is empty.

After the review

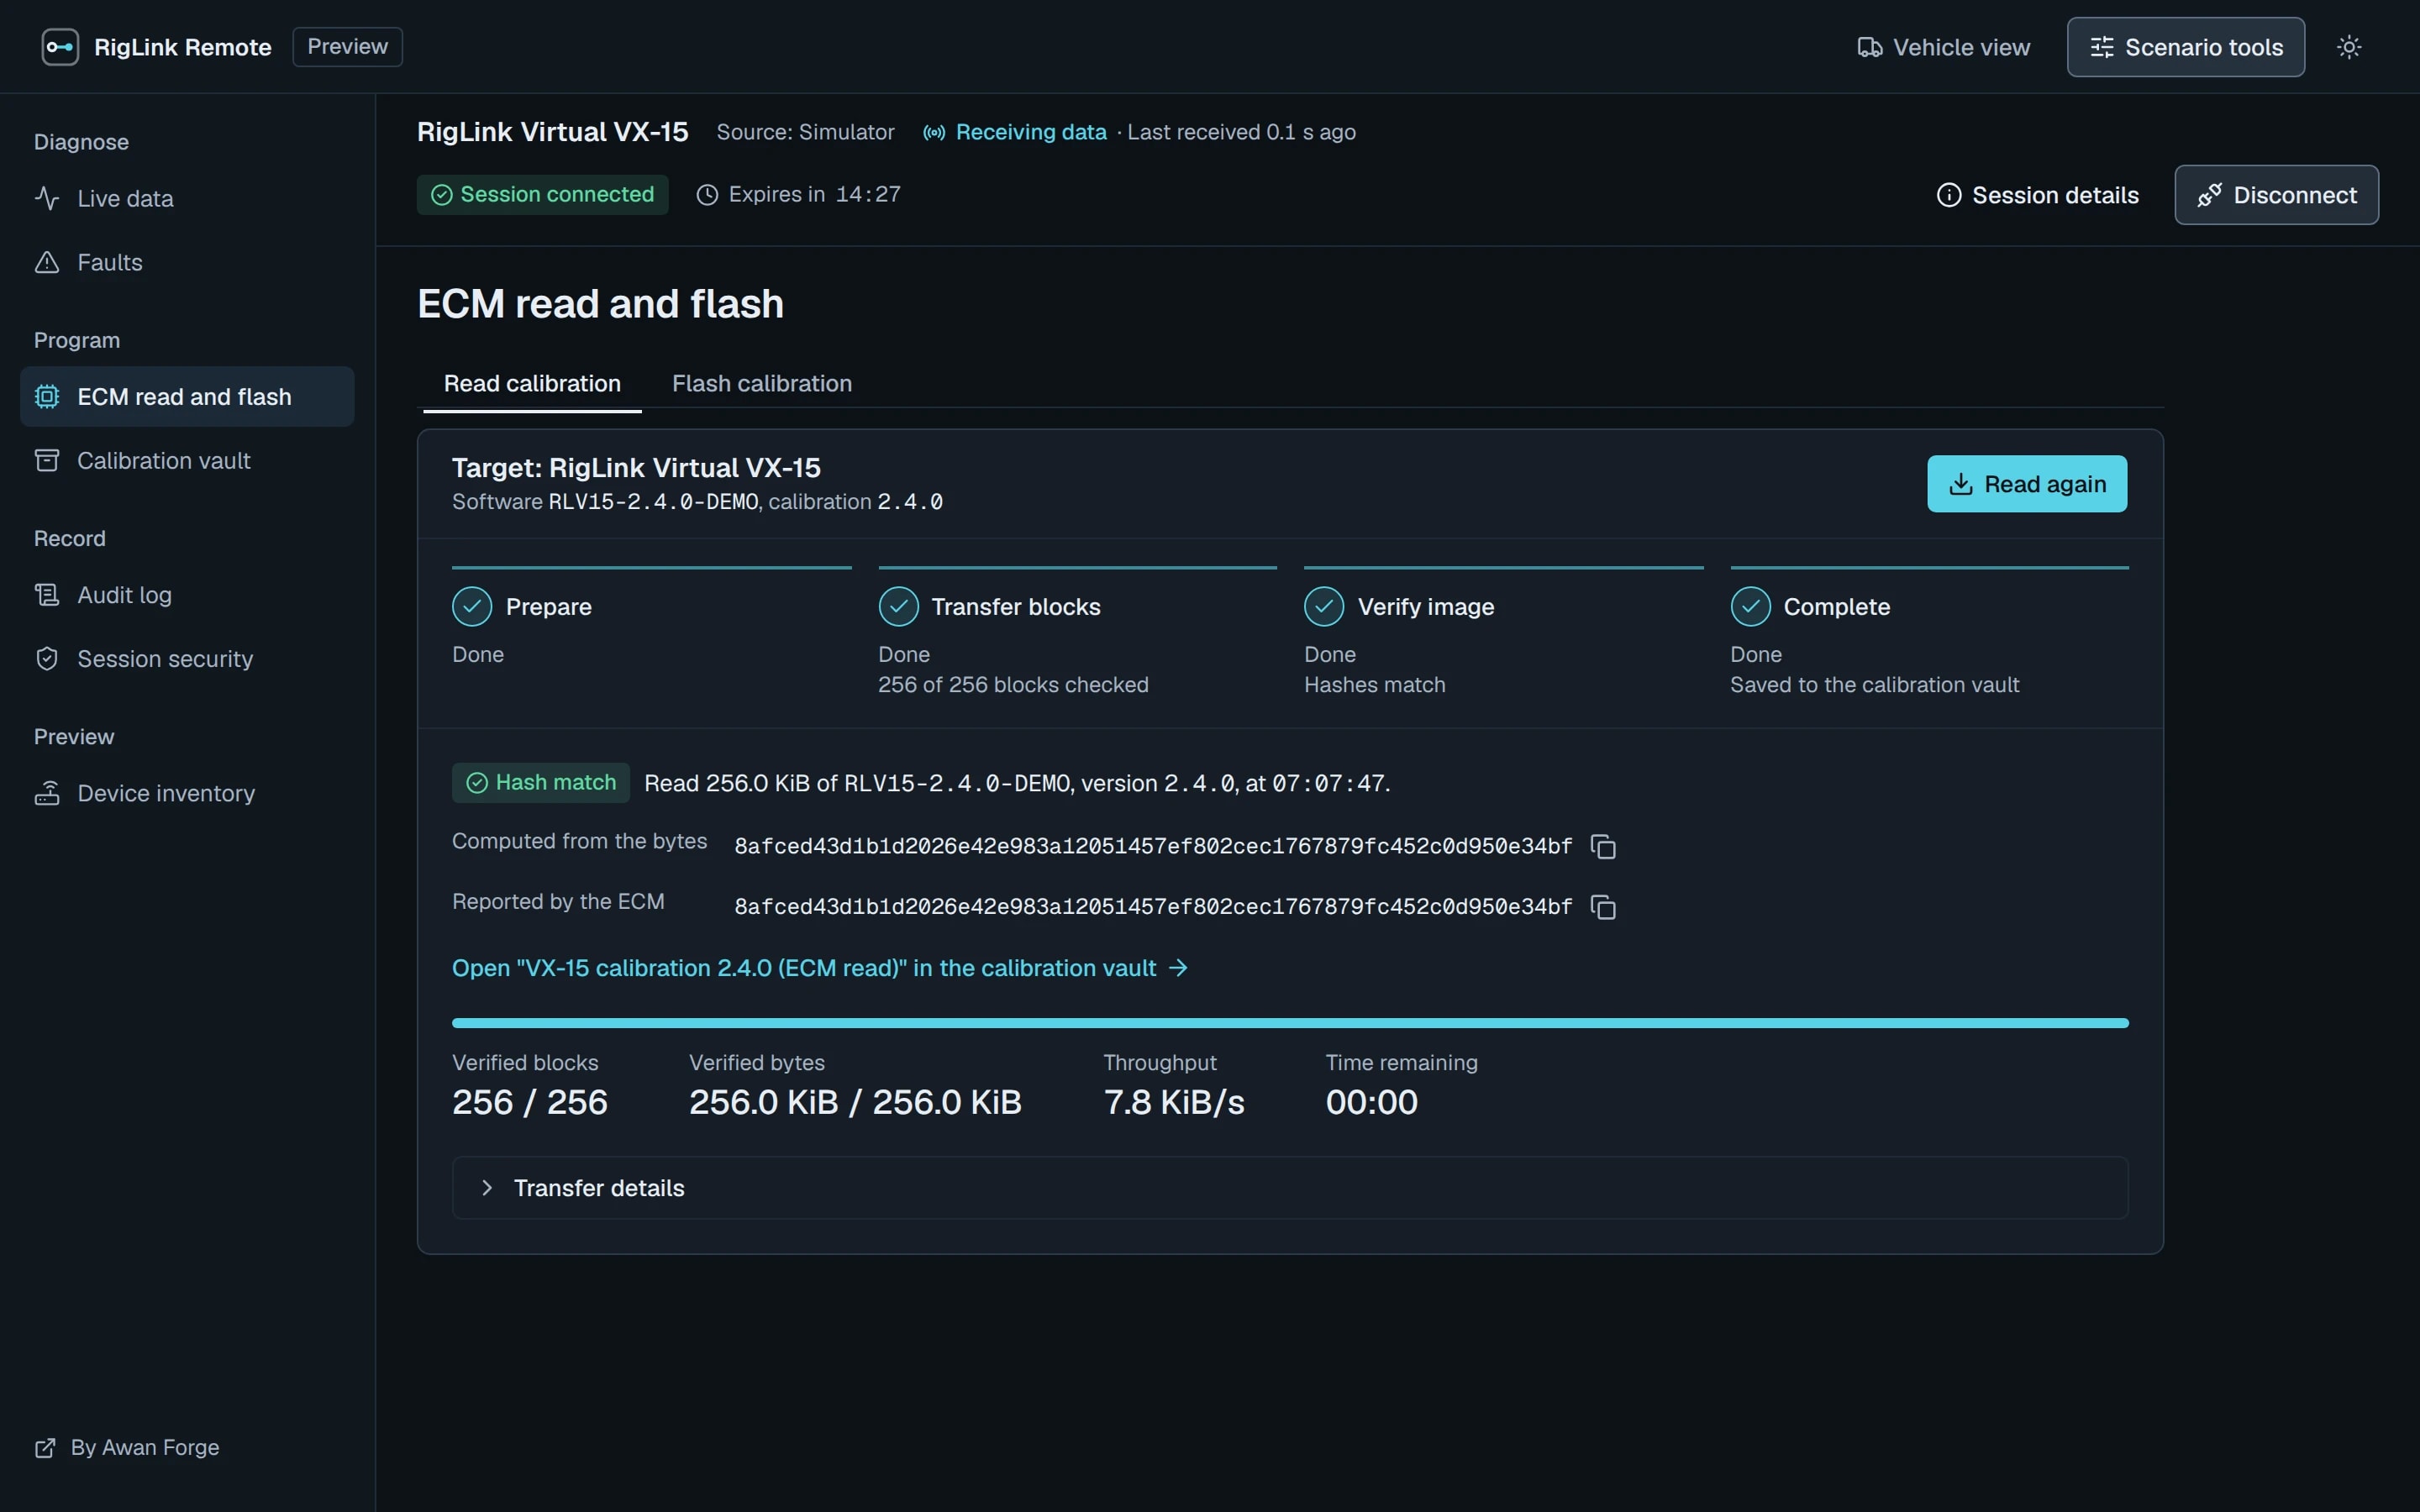
Redesigned ECM read screen as a single card with a stage sequence across the top and a completed, verified read below it.

One card: target and action, stages, then the transfer and its result.

  1. Stages in one row.
  2. Read, verified and saved to the vault.

A homepage that explained before it showed

Before: the homepage opened with a long paragraph about how the preview was built, and repeated its scope in several places.

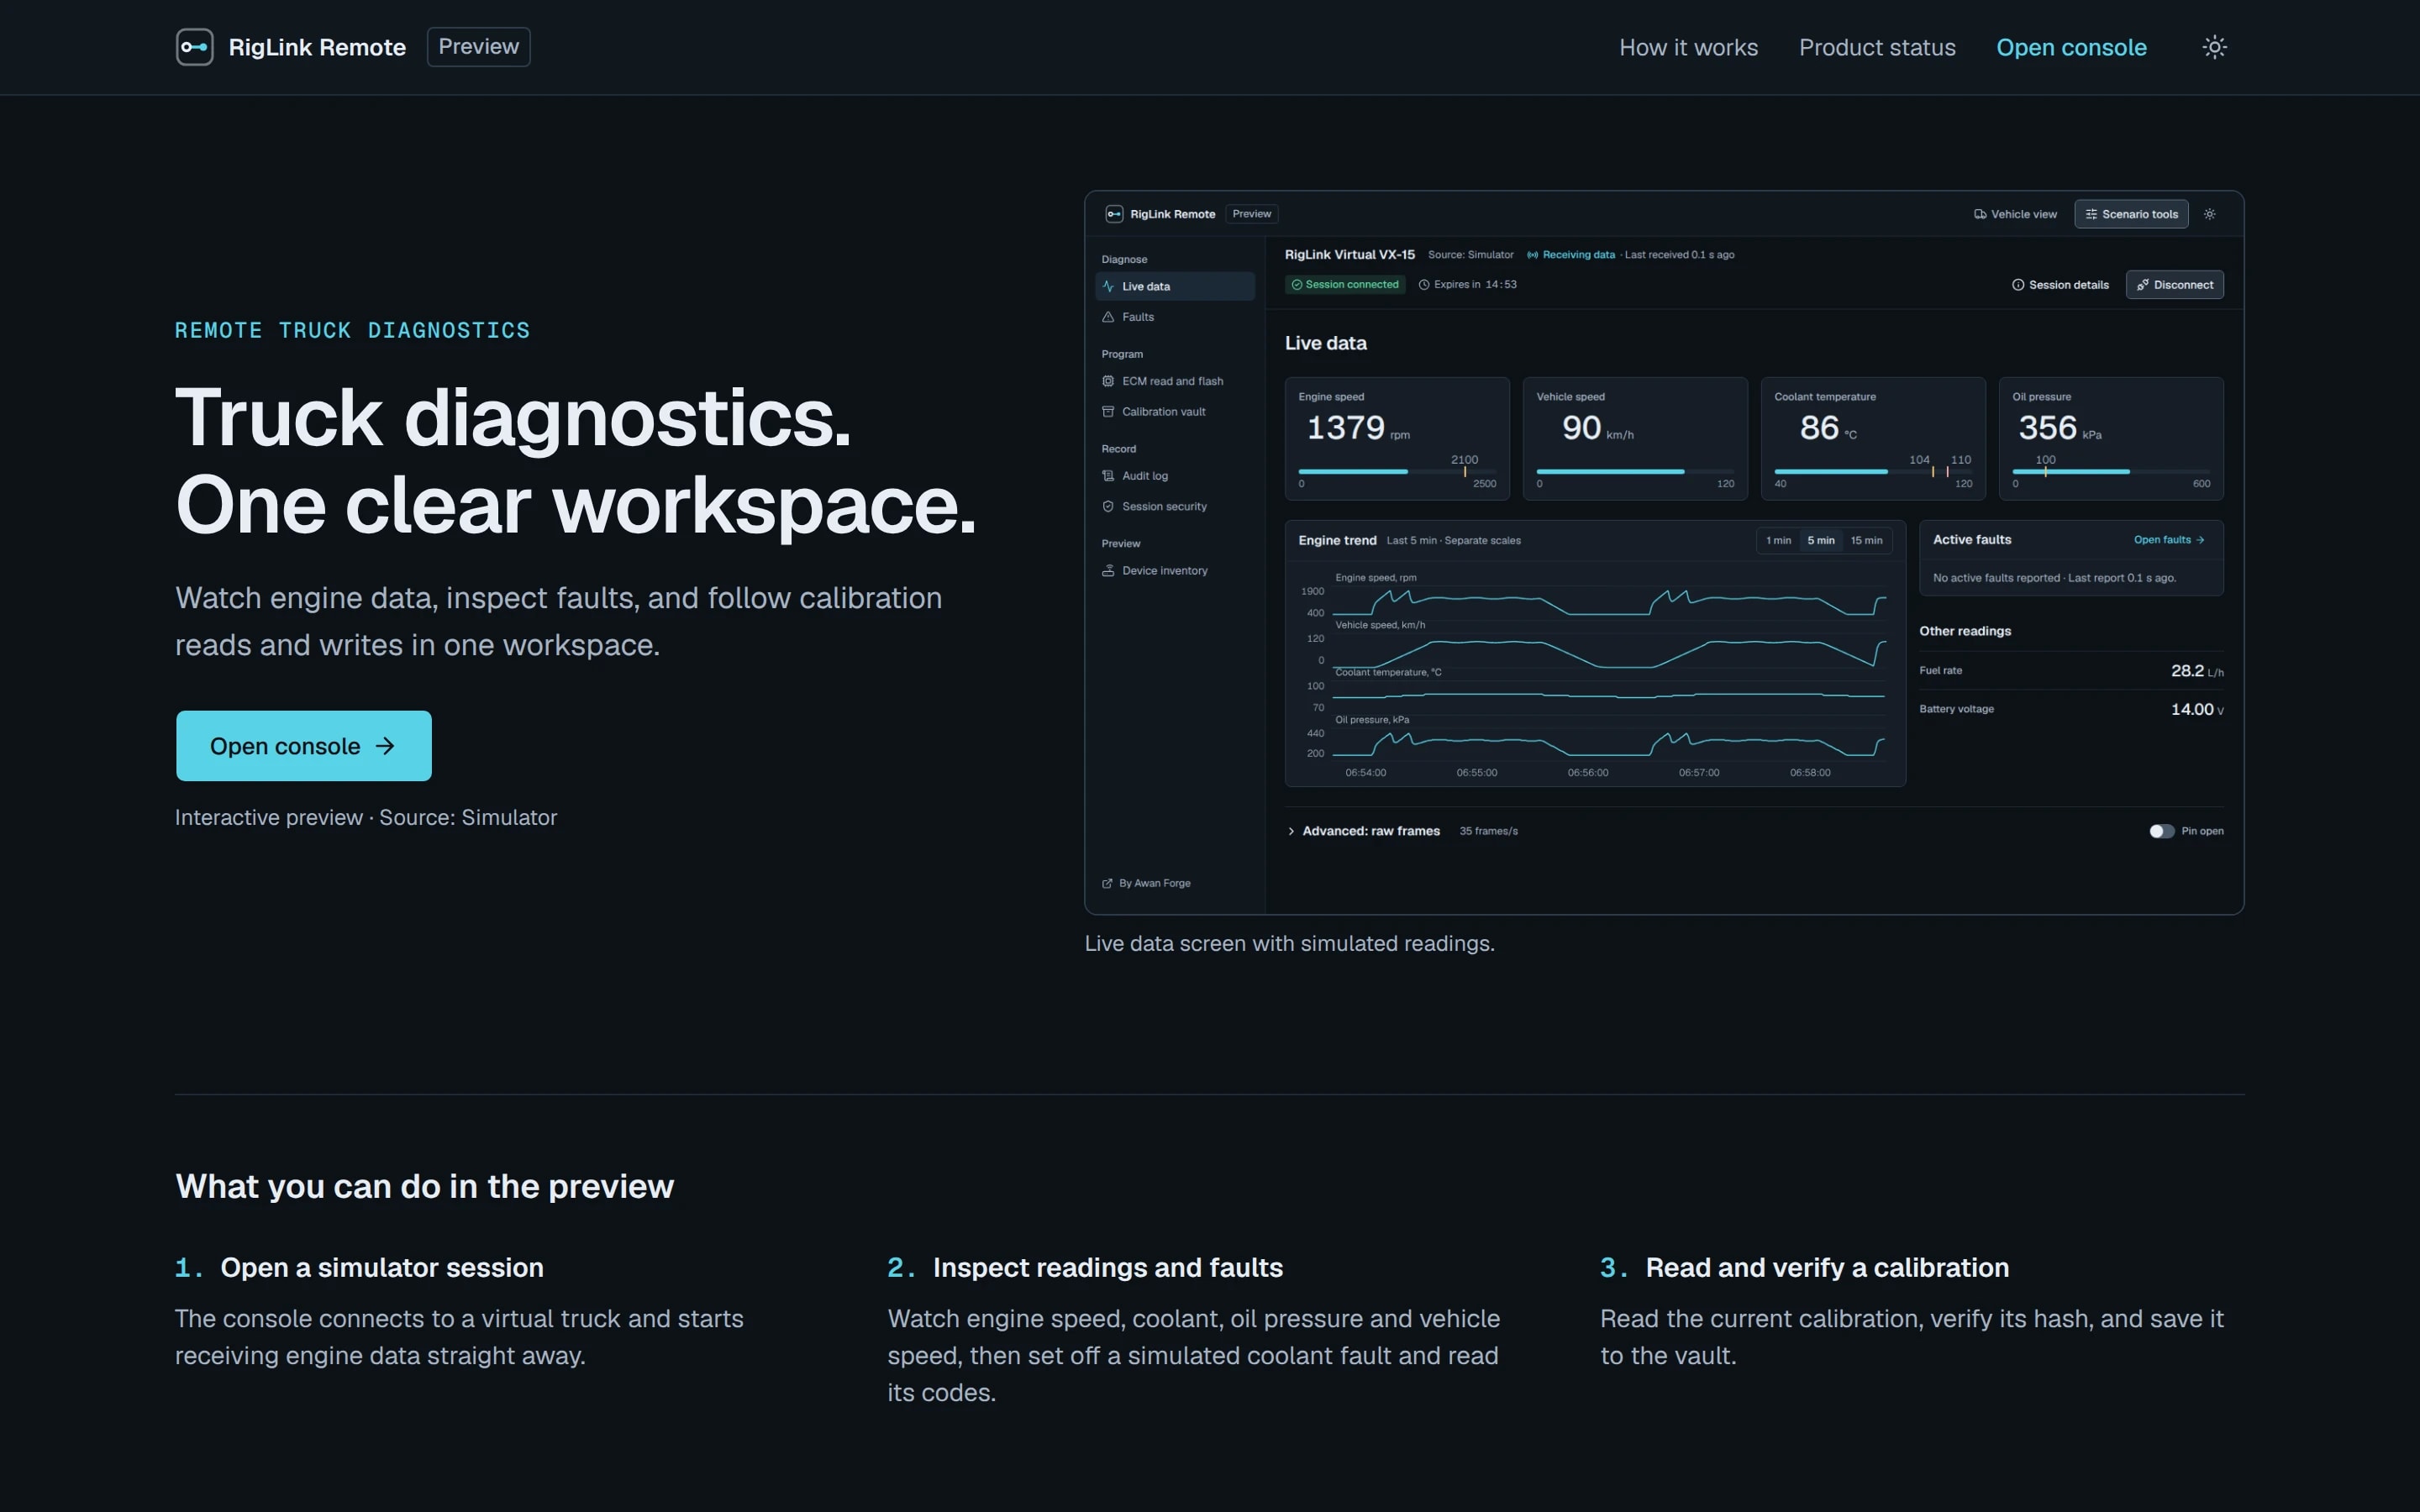
After: a short headline, two lines of description, Open console, and a real view of the console. The detailed scope lives on one page, Product status, and the console carries two small labels, “Preview” and “Source: Simulator”.

First version

The top of the first version RigLink homepage, with a long introduction about scope and implementation.

The homepage, top of the page. Scope and implementation outweigh the product.

After the review

Redesigned RigLink homepage with a short headline, an Open console button and a view of the live console.

What it is, one action, and the console itself.

  1. Interactive preview. Source: Simulator.

First version

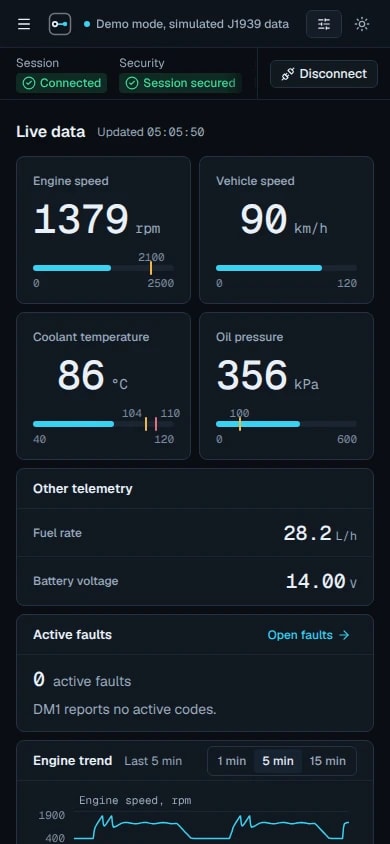
First version of the console at phone width.

After the review

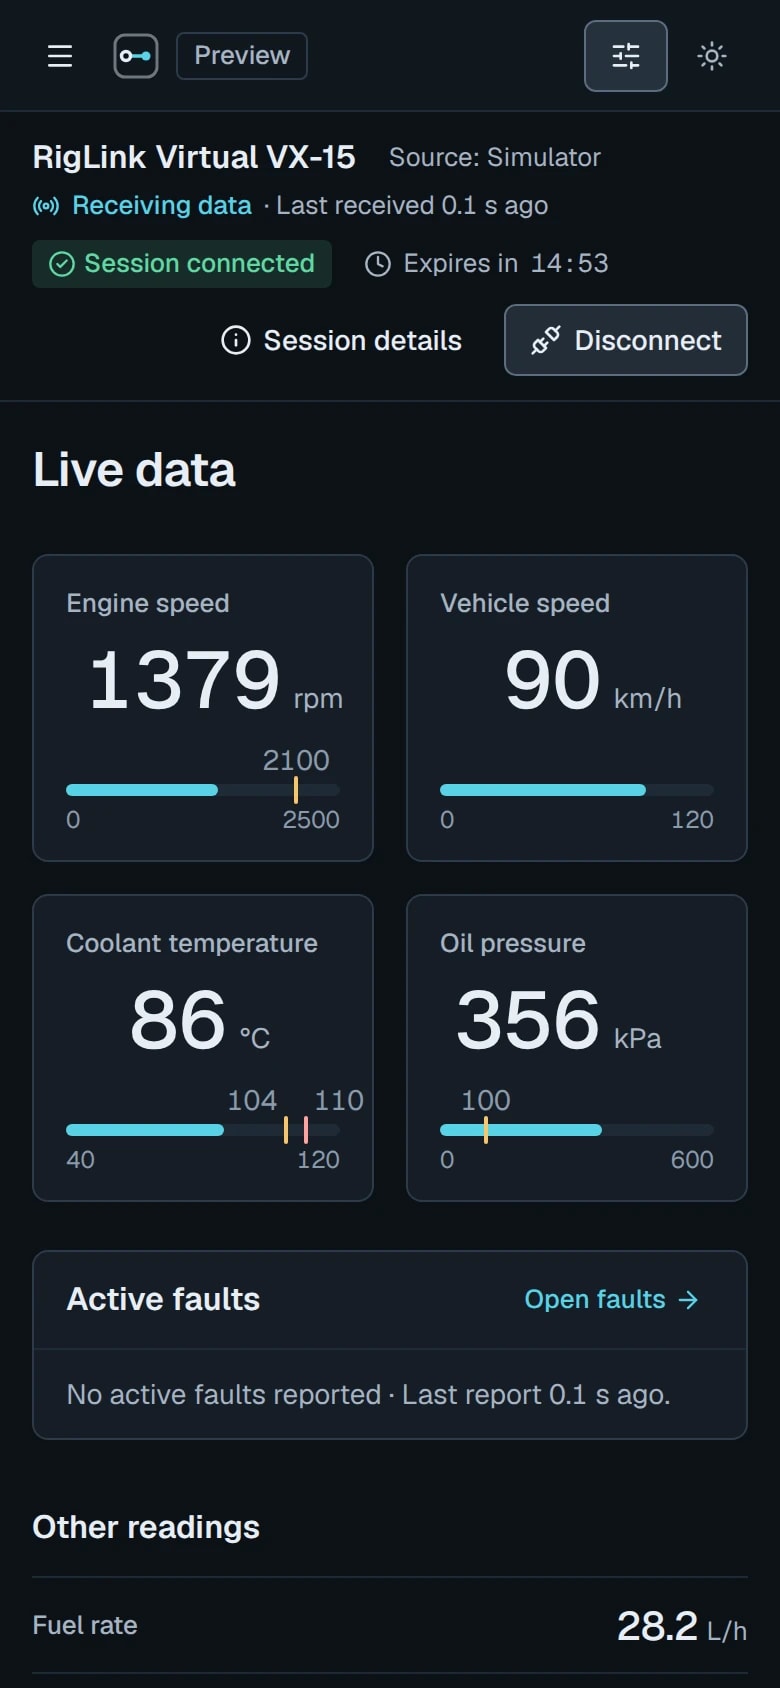
Redesigned console at phone width with a wrapping session context and four instruments in a two by two grid.

The console at 390 px, first version and after the review. The session context wraps and names the target, the data source and how fresh the data is.

What we tested, and what is live

409

unit and integration tests across the TypeScript packages

189

C# agent tests

Every layer has its own tests, and the whole application is driven in a real browser. Every check below ran on 11 November 2026. The C# tests and the interoperability run are from the run before the redesign, which changed no C#, relay or protocol code.

Checks and results, run on 11 November 2026
CheckResult
Protocol tests, including the published byte examples160 passed
Simulator tests66 passed
Session and cryptography tests65 passed
Endpoint and transfer tests49 passed
Relay tests, over real sockets34 passed
Web unit tests35 passed
C# agent tests189 passed
C# and TypeScript interoperability run10 steps passed
End-to-end tests in Chromium, on desktop and phone viewports71 tests; one is intermittent
Automated accessibility checks, WCAG A and AA, both themes, 18 screens and statesNo violations

Not verified

  • Real hardware. No adapter or truck has been connected. Every value comes from the simulator.
  • Windows. The agent's Windows application was compiled and never started.
  • Browsers other than Chromium, including Safari and Firefox.
  • Real phones and tablets. The phone layout was tested in Chromium at phone viewport sizes.
  • Screen readers.
  • Performance. Core Web Vitals were not measured.
  • The session protocol has not had an external audit.

The end-to-end tests check behavior against the data: the engine speed on screen must match the raw bytes decoded independently in the test, a dropped link must show the last verified block, and progress must never move backwards. They include the design review's acceptance checks: freshness after disconnect, a session context that is never clipped from 390 to 1920 px, the raw frames disclosure, tables without sideways scroll, reflow at 320 px and at 200 percent text, keyboard focus and trapping, type roles, and automated accessibility checks in both themes. 13 of the review's 14 acceptance checks pass. The fourteenth, status announcements, needs a screen reader and is not verified.

In one of the two full end-to-end runs on the final build all 71 tests passed; in the other, 70 passed and the trend tooltip check failed. That test passed 25 times out of 25 when repeated on its own, and it now records what it saw so the next failure can be diagnosed.

The preview is live at riglink.awanforge.com: a static site, with the relay running beside it. After the first release we opened the live site in a browser, saw the console reach “Session secured” with live data, and joined a session from a second, fully separate browser through the relay. After the redesign we checked the live console again, connected and after Disconnect.

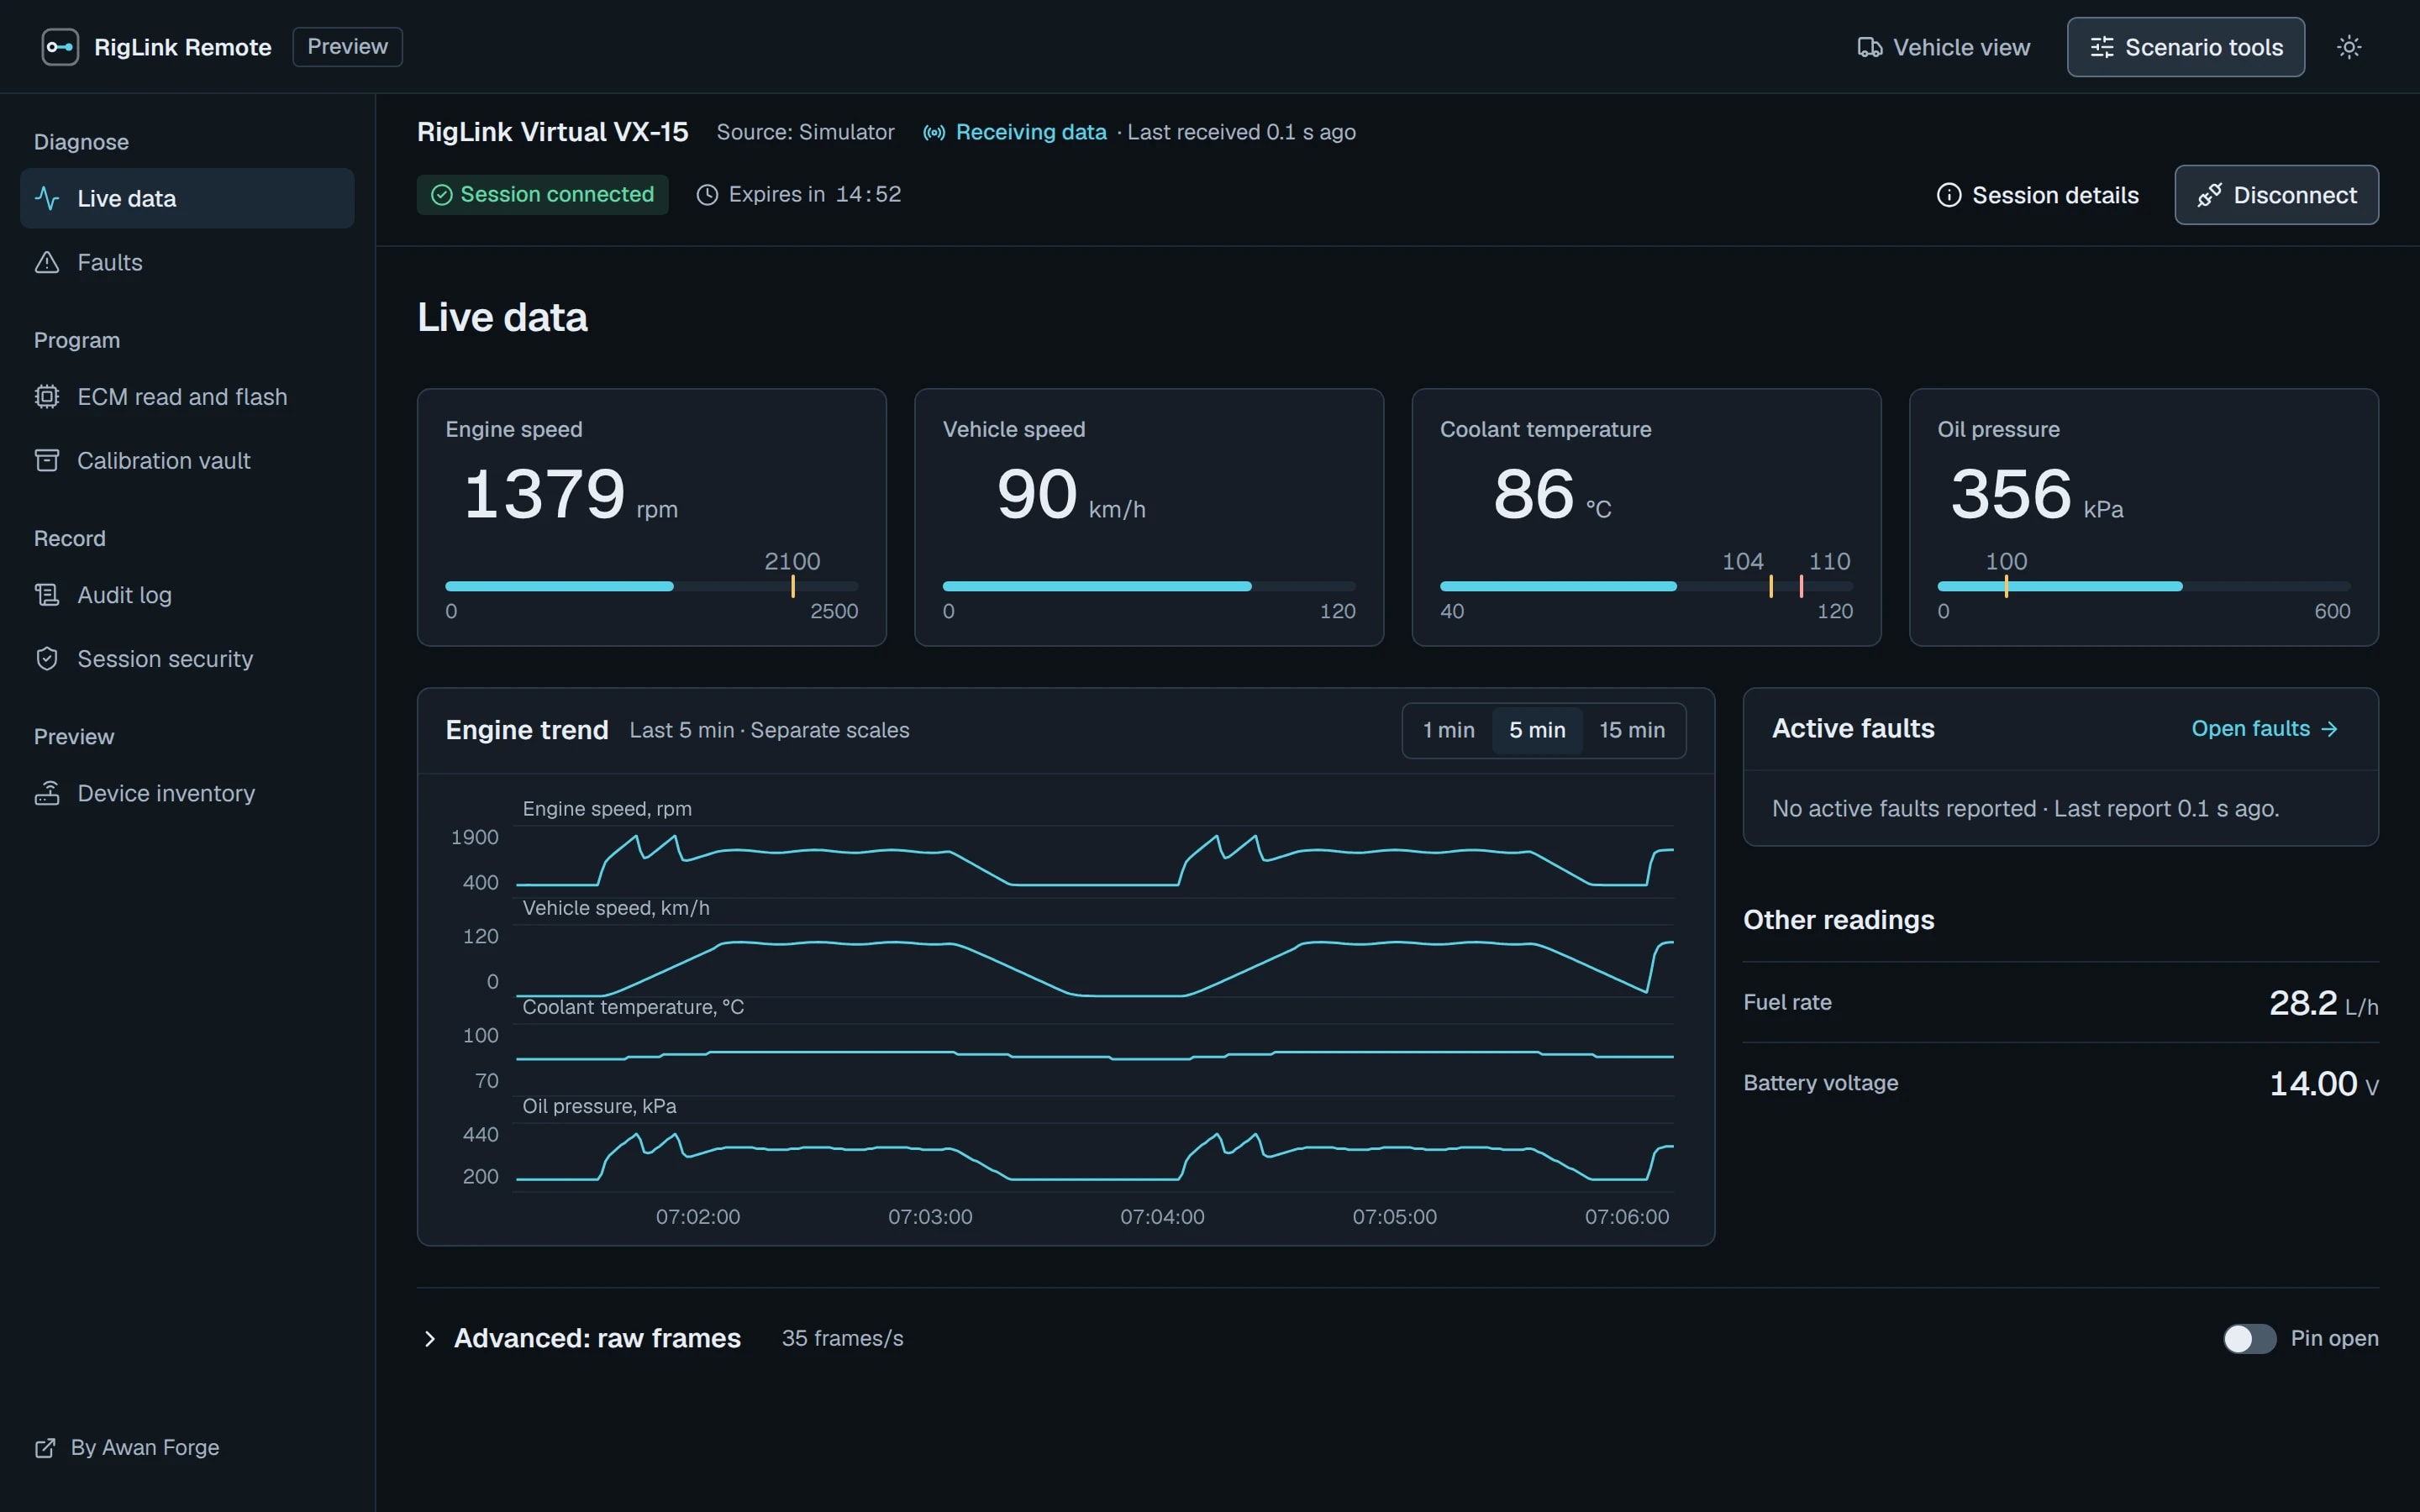
Redesigned Live data screen in the light theme.

The same screen in the light theme. Both themes are checked for contrast.

Done, and recommended next

What is finished, and what we would do next.

The design review

Done in the redesign

  • Data freshness: readings marked last known with their age, a frame rate that drops to 0 and a trend that ends at the last sample
  • A two-row session context that wraps at any width, with details on demand
  • New type roles: 24 px page titles and 16 px panel headings
  • Raw frames collapsed behind an advanced disclosure that can be pinned open
  • Row details in the fault, audit and device tables
  • One workflow card for reads, and a staged write: choose, review, transfer
  • Homepage rewritten, and a Product status page added
  • Quieter scope messaging where it repeated
  • Layout checked from 390 to 1920 px, at 320 px and at 200 percent text size; keyboard focus and trapping checked

Recommended next

  • A usability study with working technicians. None has been run.
  • Testing with screen readers, which would also verify the status announcements
  • Testing on real phones and tablets
  • Testing in Safari and Firefox
  • Privacy and Terms pages

The product

Done

  • The data path, from simulated bus frames to the console, tested at every layer
  • Encrypted sessions with resume, in the browser and in the Windows agent
  • Read and write workflow with link-loss recovery, against the virtual ECM
  • Relay for sessions between separate machines
  • Windows agent core, tested and interoperable with the console
  • Live preview

Recommended next

  • Validation with a real adapter, its drivers and a vehicle, starting on a bench
  • An independent review of the session protocol, or its replacement with an established one
  • Controller-specific programming, with the manufacturer's procedure and authorization
  • Accounts, device registration and server-side authorization
  • A durable relay that runs as more than one instance, and a server-side audit log
  • Running and testing the agent on Windows

How we work

RigLink shows the order we work in: research and a written contract first, then the build, then checks that can fail. Where something could not be built honestly, such as hardware support without hardware, we built the layer it will plug into and labeled it. When a review found faults in our own first version, we fixed them and kept the evidence.

Open RigLink

Runs in your browser on simulated data.